by Matt Hurt
Since the Region VII superintendents initiated the Comprehensive Instructional Program in 2014, we have annually identified our top five most successful teachers of our most at-risk students in each SOL-tested course. In their classes, at least 50 percent of students were economically disadvantaged, and they also had a significant number of students with disabilities. Despite that, their SOL pass rates were very high, even higher than many teachers’ pass rates who had few economically disadvantaged students and no students with disabilities. When asked, all of these teachers have conveyed a common theme: they expected their students to pass the SOL test, and the teacher believed it was his/her job to ensure that happened.
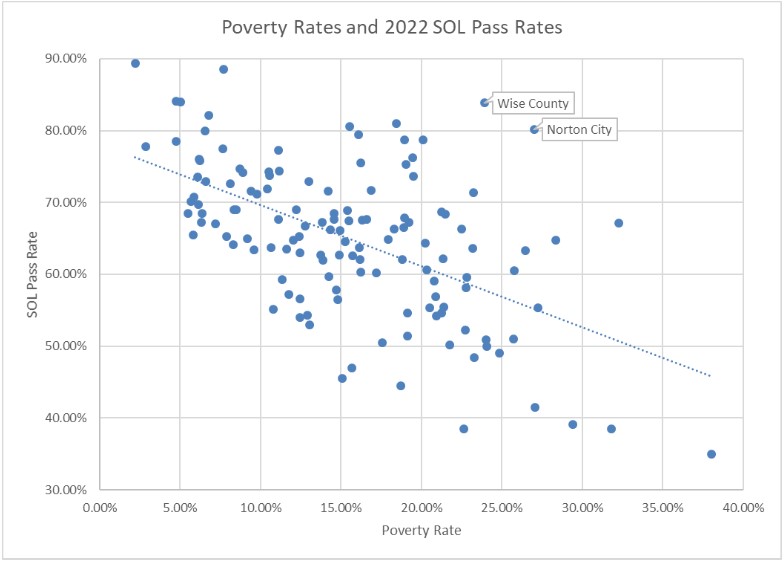
Similarly, we find the theme of high expectations rampant in our most successful schools and divisions in our high poverty areas. For example, Wise County and Norton City were the two divisions that outperformed the relationship between poverty rates and SOL performance in 2022 (as well as several years prior). This relationship accounted for 30 percent of the variation in overall SOL scores among all 132 divisions that year. The poverty rate in these two divisions is greater than approximately 90 percent of other school divisions in the state, and they are also typically the least-well-funded two divisions in Virginia when considering overall per-pupil funding. Despite those challenges, these two divisions outperformed 95 percent of all other divisions in 2022.
Figure 1
2022 Overall Division Pass Rates Compared to Federal Poverty Rates
Continue reading