
This is the second of a three-part series on school discipline. The authors present information and provide discussion questions for the audience to respond. We hope the discussion will further an understanding of the complexity of school discipline and safe and orderly schools within the context of the presented data.by Matthew Hurt and Kathleen SmithFindings from Virginia Data
Data on school discipline are abundant, but not always reliable. The reasons are many. Overall, data are reported by infraction to the Virginia Department of Education (VDOE) and to the Office of Civil Rights by each school division. One kind of infraction in one school division may be deemed another kind of infraction by another division. For example, using a curse word while talking to a teacher could be considered disrespect or a threat, depending on who is entering the data in the system. Although the VDOE has attempted to clarify the language over time, it still may not be reliable. For this reason, the data used herein refer to only a few data points of what is reported to the Office of Civil Rights by divisions for each school every two years in 2015-2016 and 2017-2018. This data can be found here. Some data are highlighted below.
Congruency Matters in Learning and Discipline Data
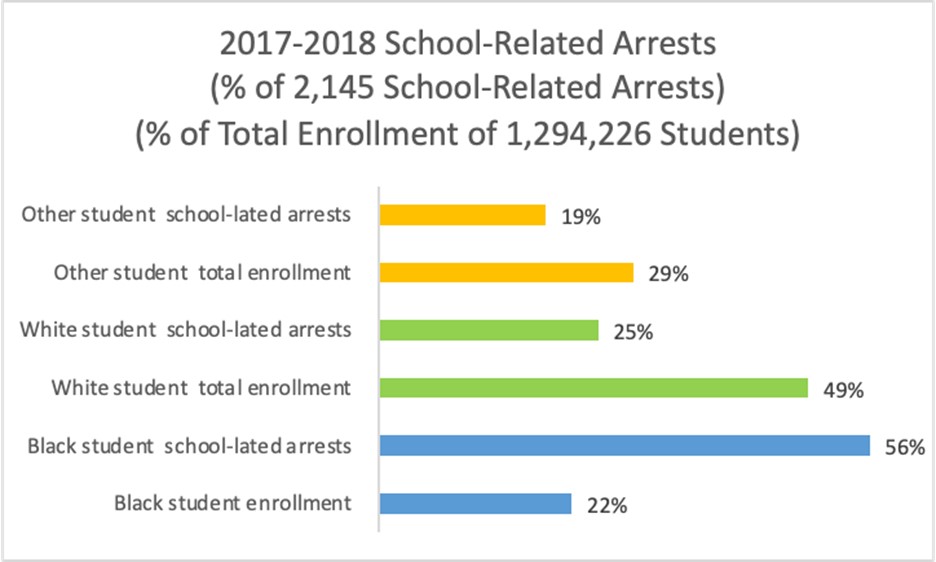
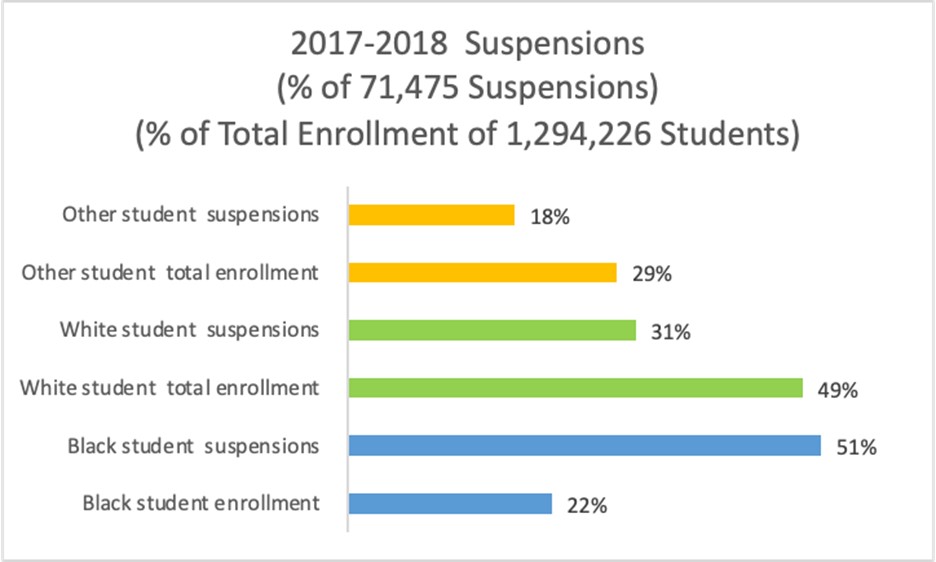
Congruency means that percent of total of a discipline indicator should be similar or equal to the enrollment percent of total. In other words, in 2017-2018, if 22 percent of students are Black, then 22 percent of Black students should have been suspended. In 2017-2018, 51 percent of the total number of suspensions were of Black students. This means that the Black population’s results are not congruent to the actual percent of the Black students in the total population.
Similarly, if learning and discipline are intertwined, then data should show that a change in the achievement (learning) should be equal to a similar or congruent change in discipline indicators. Hypothetically, if discipline improves, achievement improves, as it should.
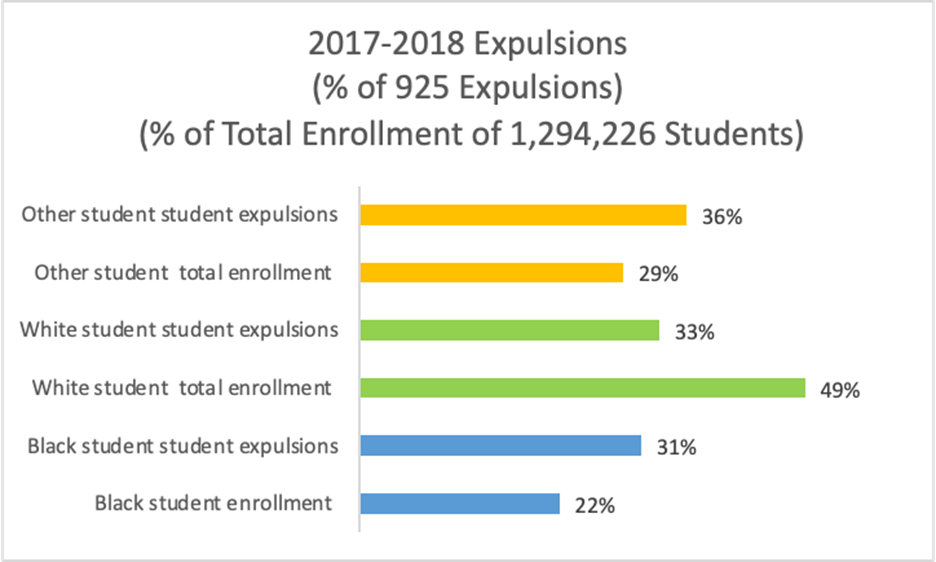
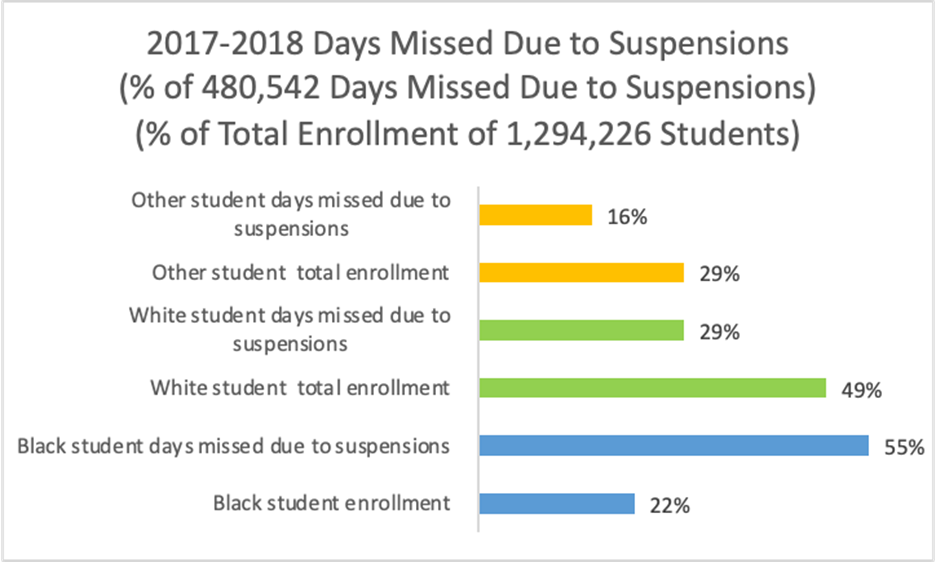
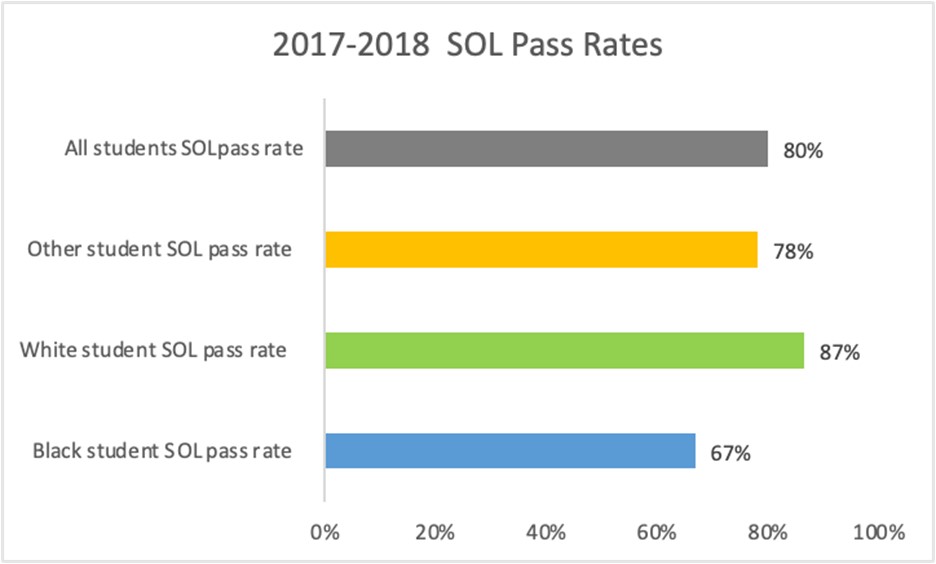
The SOL pass rate for Black students stayed about even (-1 percent), suspensions (0 percent) and days missed from school (-3 percent) stayed about even, expulsions went down (-7 percent). School arrests for Black students went up by 19 percentage points. For White students, school arrests went down by -13 percentage points. A total of 480,542 days were missed due to suspensions in 2017-2018. That is a lot of time out of school for students who are already behind and were suspended.
Given the data below, how could school arrests increase and expulsions decrease for any subgroup? These data should be somewhat similar — if arrests increased, then expulsions should have increased. Perhaps some school arrests resulted in suspensions but then suspensions should have increased, not the case for Black students. This is what makes data analysis so difficult.
Understanding Disproportionality
The Joint Legislative Audit and Review Commission (JLARC) report, Pandemic Impact on Public K-12 Education (November 2022), pointed out that our students exhibited disruptive behavior as they returned to in-person instruction (though quantifying the increase is difficult because of data limitations).
There are additional factors at play today that have been persistent for years but have gained more of the spotlight in recent years. One of those factors is the significant disproportionality in school discipline between our Black and White students.
The April 2021 Board of Education (BOE) Presentation on Disproportionality in Discipline indicated that VDOE measures discipline disproportionality and reports using data reported by school divisions through the Student Behavior and Administrative Response (SBAR) Data Collection. The SBAR system attempts to inform practices through gathering comprehensive information on student behavior, discipline sanctions, behavioral interventions, and instructional supports; standardizing the definitions and calculations of metrics; and attempting to create consistency in communication and reporting.
Further, VDOE staff, as part of this presentation to the BOE, provided a recommendation by Virginia’s African American Superintendent’s Advisory Council and the Mid-Atlantic Comprehensive Center to include discipline disproportionality as an indicator in the state’s accountability system.
VDOE currently measures disproportionality as a “relative risk.” Relative risk for Black students is defined as:
Number of Black students suspended / Number of Black students
Number of non-Black students suspended / Number of non-Black students
Comparing the data from the Office of Civil Rights from Virginia for 2017-2018 and 2015-2016:
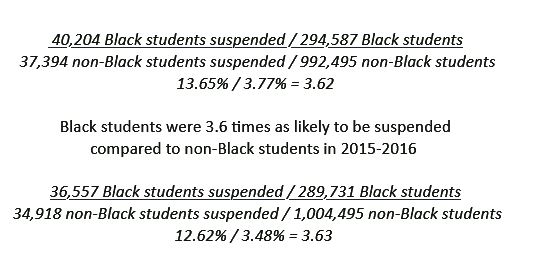
Black students are 3.6 times as likely to be suspended compared to non-Black students in 2017-2018.
No change at all.
Further Discussion Questions
A deep dive into school discipline is important. It allows one to see the other side of the story. Administrators are required to report data. Data collection is cumbersome and lengthy. The Office of Civil Rights requires school administrators to report 1,430 different data points for each school in each division. In addition, school divisions report all kinds of data to VDOE through secure web-based systems. The list from the VDOE website below does not include federally-required data for all of the Title programs. Also not on the list are ongoing formative assessment data that are key for understanding if students are learning and what they are learning.
• Student Record Collection
• Master Schedule Collection
• Student Behavior and Administrative Response Collection
• Positions and Exits Collection
• SOL Substitute Test Collection
• Finance
• Career & Technical Education
• Special Education
• Pupil Transportation
• School Safety
• Educational Registry Application
• Virginia Youth Survey
• Calendar of Data Collections (PDF)
Are these collections unfunded? Time-consuming? Necessary? When do principals and teachers have the time to review this data? Does the quest for data inadvertently cause misleading conclusions or less-than-reliable reporting?
Given the data, there was no change at all from 2015-2016 through 2017-2018 in the relative risk for Black students being suspended. What does this tell us? Did we ignore the problem of disproportionality? According to the data from the Office of Civil Rights, 37 percent of total school-related arrests were of Black students in 2015-2016. And 56 percent of total school-related arrests were of Black students in 2017-2018, an increase of 19 percent. Suspensions remained about the same and expulsions showed a decrease of 7 percent. Does this data show any congruence?
A total of 480,542 days were missed due to suspensions in 2017-2018. Of the total number of days missed, 55 percent were missed by Black students. What effect did this have on disproportionality and SOL scores?
Another conundrum for consideration: a principal is told by central office staff that the school’s disproportionality rate is too high, that it appears that Black and Brown students are being suspended disproportionately compared to White students. What does he/she suggest to his faculty? How does he/she mitigate the factors of cultural differences versus unacceptable behavior? For example, using a cell phone in class or bullying a peer?
We welcome your discussion.
Part III will discuss how Virginia is reframing school discipline.
Matthew Hurt is director of the Comprehensive Instructional Program, a coalition of non-metropolitan school districts. Dr. Kathleen M. Smith has been an educator since 1975. She has served as Regional Director for the Mid-Atlantic States for Advanced l Measured Progress and Director of the Office of School Improvement with the Virginia Department of Education.
Leave a Reply
You must be logged in to post a comment.