
by Carol J. Bova
Governor Ralph Northam opened his July 14 press conference with statements on the increase in cases of the COVID-19 virus in Virginia. “We have not seen the spikes that some other states are now seeing, but we’re seeing some troubling numbers and an increase in cases largely out of the Hampton Roads area.”
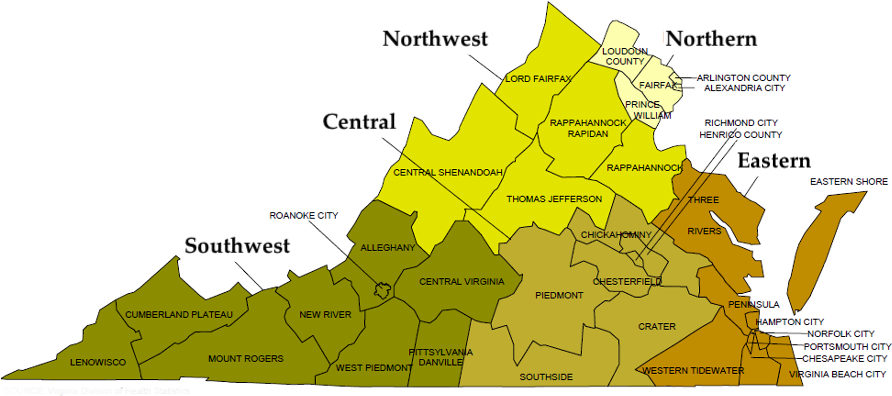
He talked about the statewide positivity rate for COVID-19 testing, using graphs for five regional Health Districts and reviewed the seven-day average for each: Northern region, 6.7%, Southwest region 4.8%, Northwest region 5.9%, and Central region 6.6%. He then called out the Eastern region for a rate of 10.1%.
There are at least two serious problems with his presentation.
The regions cover too wide a geographical area to address as a single community, and each varies in population, density, culture, and composition.
For example, the Eastern Region covers Hampton Roads, Western Tidewater, the Eastern Shore, the Peninsula, the Middle Peninsula, and the Northern Neck. Focusing on a region this large is misleading because it implies the entire region is experiencing the same increase in cases, rather than large increases in specific localities with minimal change in others.
The use of the seven-day positivity rate as a metric is a potentially confusing oversimplification.
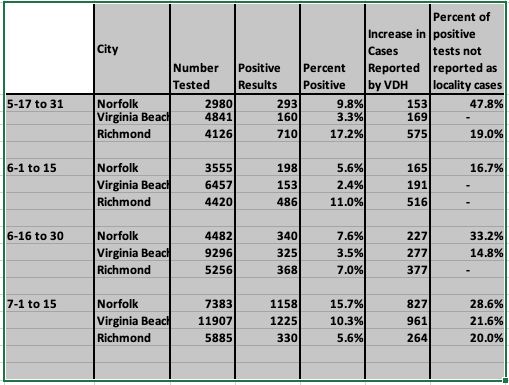
VDH counts multiple tests from the same individuals toward the positivity rate on each test date, but the results are not added to a locality’s total confirmed case numbers. (Say a person is tested positive twice. The duplicate results are counted in the positivity rate number but not the confirmed cases number.) The same is true for positive tests from persons from out of the area or out of state; they are included in the positivity rate, but not added to the locality’s confirmed cases as shown in the chart below.
A seven-day rolling average for positive results is an indicator, but cannot tell the whole story because it covers only tests received during that period. VDH updates the numbers by test date as results are recorded, but not all test results are received within a week of testing. Consider the time it can take to see or talk to a doctor about testing, then one to three or more days to schedule a test, plus a day or more for the test to be completed, a day for the Virginia Department of Health (VDH) to receive and record the test results, and another day for VDH to report them on the COVID-19 Dashboard, and further delays can happen at any of these stages.
Who is being tested influences the positivity rate. A higher rate generally indicates the need for more testing to define the scope of the spread, but positive tests do not indicate infection severity. We know from prevalence testing there can be a large percentage of persons with positive tests and minimal or no symptoms. Hospitalization and death rates are the key metrics that need to be followed.
Testing in Richmond was only up 33%. Why weren’t Richmond’s tests increased in the same way as Norfolk and Virginia Beach? Are the number of tests and cases diluted by reporting them as Henrico and Chesterfield rather than Richmond City?
There is no question that Norfolk and Virginia Beach had serious increases in cases from June 30 to July 15. Henrico, however, had a positivity rate of only 5.7% on July 14, while VDH shows a 13.7% increase in cases from June 30 to July 15, and Richmond a 12.0% increase in cases, which the Governor failed to mention.
Photos in the news and on social media still show undistanced crowds, some people with masks, many without, demonstrating at different locations in Richmond, and reports of vandalism by mobs continue.
When I asked last week why the Governor hasn’t addressed the multiple demonstrations and vandalism as a factor in the spike in cases, I received a polite response to an email, but no answer. That response was, “It is the responsibility of the localities to deal with demonstrations and vandalism. The Governor, with input from the Virginia Department of Health, is continually analyzing the health data in relation to current events.”
Localities don’t write the governor’s press releases or plan his press conferences, and it looks like VDH isn’t providing enough input for the Governor to acknowledge that the protests and statue-toppling crowds did not help the COVID situation. The Governor might want to consider that shouting spreads droplets beyond six feet, and the people still taking to the streets in Richmond are a lot closer together than that, as shown in the photo accompanying “Law and Disorder in Richmond.”
Carol J. Bova is a writer living in Mathews County.

