

Don’t be this guy.
by James A. Bacon
Once again Virginia is gripped by COVID-19 hysteria, this time whipped up by a surge in the number of confirmed cases. The situation needs to be taken seriously — people are getting sick, and people are dying — but the wide-eyed alarmism likely isn’t justified.
Let’s start by looking at the seven-day moving average of confirmed cases reported on the Virginia Department of Health dashboard, which is the basis for the panic.
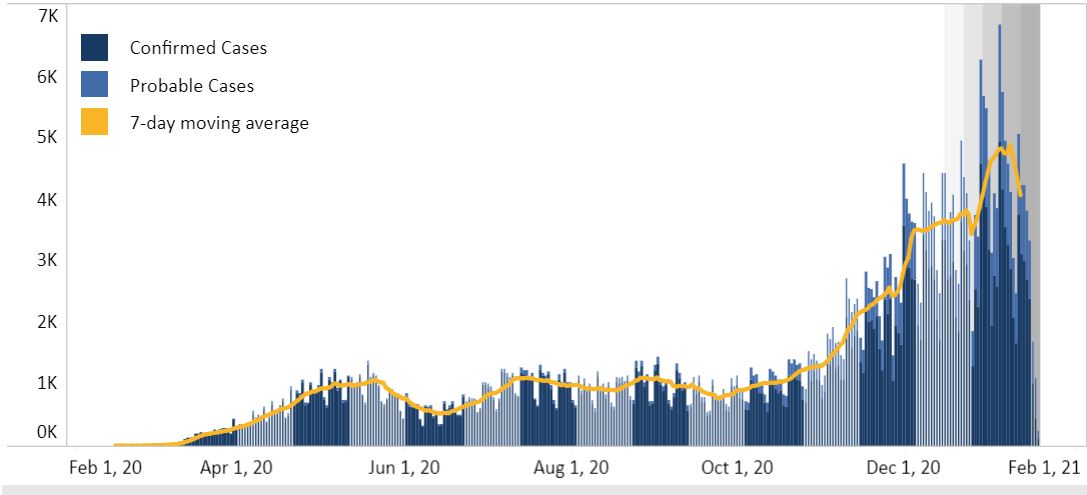
Based on these numbers, the spread of COVID-19 appears to be terrifying. The seven-day moving average is approaching 5,000 new cases reported daily — roughly four times the rate of the spring and summer peaks.
But the question arises, are more people getting COVID-19, or have we just massively expanded the level of testing? Are we capturing cases that we missed back in the spring and summer?
To answer that question, let’s now look at VDH’s testing data. Lo and behold we see that Virginia’s testing capacity has increased markedly (if belatedly) since the beginning of the epidemic ten months ago.

Thus, part of the jump in confirmed cases probably can be attributed to the ramp-up in testing. But only part.
VDH publishes another chart, which shows the number of “positive” tests as a percentage of total testing encounters. A larger percentage of positive tests suggests that the virus is more prevalent in the population. The value of the percent-positive measure was limited in the early months when testing capacity was scarce and tests were given mainly to people whose symptoms were severe enough to warrant hospitalization — a highly unrepresentative sample. Now that everyone who wants a test can get one, one would hope, the indicator is much more useful.
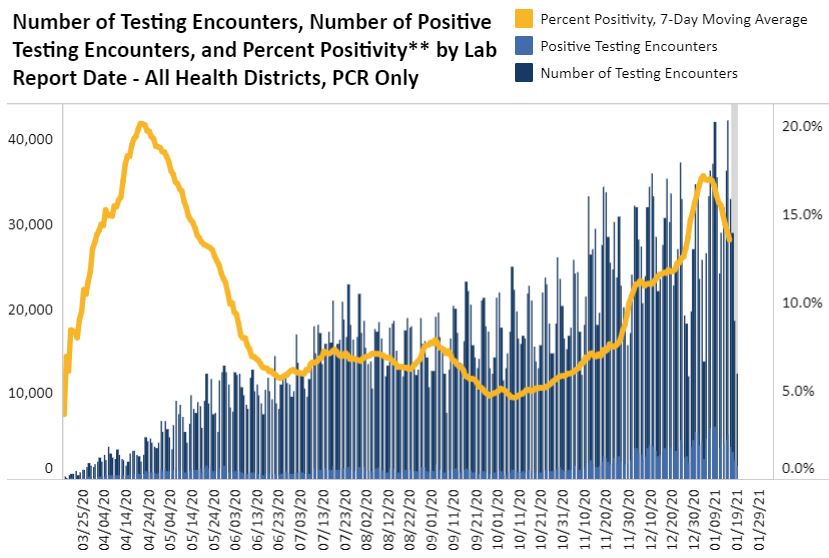
This chart shows that the percentage of positive tests has spiked, which suggests that the virus is far more prevalent now.
But maybe not.
Yet another data series — the number of hospitalizations — suggests that the situation is not so dire. Yes, as can be seen in the graph below, we have hit a new high in hospitalizations, but it’s only slightly higher than the spring peak. Unlike the number of confirmed cases, the number of hospitalizations is not busting through the stratosphere. A genuine cause for concern, but not for panic.

Consistent with the hospitalization numbers shown above is the number of reported deaths, as seen here.
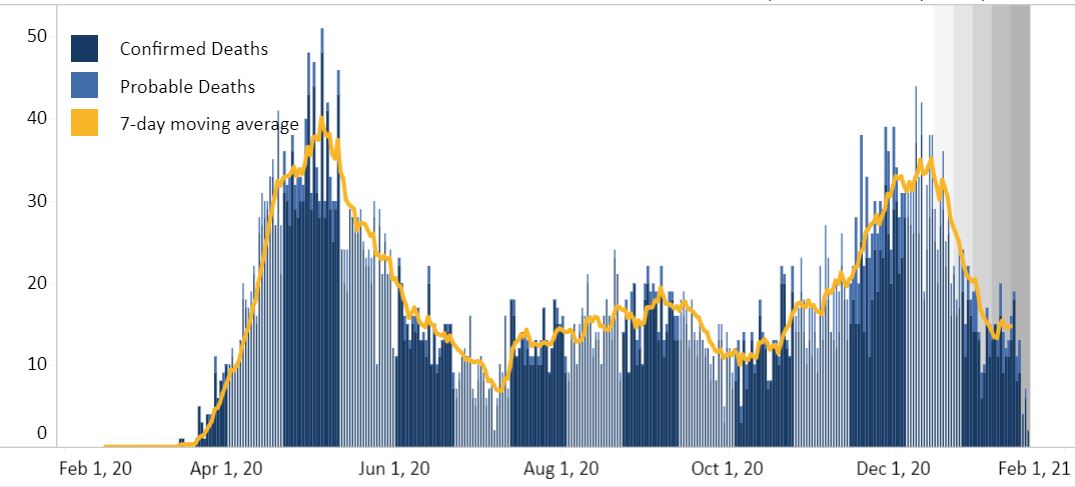
Yes, the number of COVID-related deaths has increased recently, reaching a seven-day moving average of almost 40 per day. But that’s slightly less than the spring peak. Of course, we have to consider the fact that COVID treatments have improved significantly in the past half year, so front-line hospital workers are saving lives that would have been lost six months ago. Even so, this data is hardly consistent with an epidemic raging out of control.
Which brings me to some data sleuthing that I would love to take credit for but is in fact is the handiwork of an individual who asks to remain anonymous on the grounds that, he says, “I’m not sure my employer would appreciate me criticizing the government.” I post his analysis here:
As I’m sure you’re aware, the Commonwealth of Virginia has reported an extremely large number of COVID cases over the last few days. I’ve been monitoring the Virginia COVID situation rather closely, and I’m quite certain something is skewing this data over the last four days. I’ve tried to find mention of these anomalies in the media, and I’m not surprised they have yet to report on this at all.
The Virginia Department of Health maintains several data sets pertaining to COVID, some of which are updated daily. The most viewed and downloaded of these reports cases by municipality and Health District. If you only look at this data set, you’d think we’re suffering from a massive surge of COVID infection all over the Commonwealth.
However, the VDH also reports the same data in a separate, and far less viewed, set called Cases By Age Group. This data set reports the cases, hospitalizations, and deaths in each Health District, broken down into ten-year age increments. Additionally, it also contains a small number of cases each day that have a “missing” birthdate, and thus cannot be categorized by age. To establish a baseline for you, during the first 13 days of January, the number of cases in the “missing” category averaged 17.46 statewide. The running total of cases in that category stood at 2,444 on the 13th.
On the 14th, VDH reported a total of 569 cases with a missing DOB. That was followed by 461 on the 15th, 2,302 on the 16th, and 6,441 on January 18
Of those 9,773 cases without DOBs over the last four days, 2 were reported as hospitalized. That works out to a hospitalization rate of 0.0205%. Even if all 9,773 of these reported cases were to somehow be children between the ages of 10-19, which is the age group with the lowest cumulative hospitalization rate in Virginia (0.47% over the course of the Pandemic, and 0.23% between Dec 1st and Jan 1st), the rate of hospitalization reported with these phantom 9,773 cases is completely and totally implausible.
Unless, of course, something else is going on here.
My best guess is that these test results have been generated by mail-in at home COVID tests which were run for 40 or so cycles, which will report just about any exposure to the COVID virus as a “positive” case, regardless of whether the tested individual is actually infected.
Bacon’s bottom line: If my correspondent’s hypothesis is correct, the statistical spike in confirmed cases reflects in part an increase in the number of hyper-sensitive mail-COVID tests rather than a rocketship-to-Mars blast-off in the prevalence of the disease.
I invite Bacon’s Rebellion readers to dissect my correspondent’s reading of the data. Sadly, we are not seeing this level of inquiry either from state government or the media. We citizens need to do the heavy analytical lifting ourselves.

