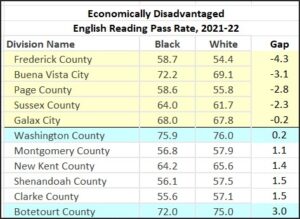
In this table a negative gap indicates that disadvantaged Black students passed their English reading SOL tests at a higher rate than their White counterparts. Among Virginia’s 132 school districts, there were five such counties.
by James A. Bacon
A major concern arising from the latest Standards of Learning (SOL) data is the fact that the racial divide between Asians and Whites on the one hand and Blacks and Hispanics on the other has gotten wider over the past three years. This disturbing trend has occurred despite unprecedented efforts to reverse the achievement gap.
Liberals, conservatives and woke progressives all want to close that gap. Before effective action can be taken, however, it behooves us to understand the underlying causes — not only why a gap exists in the first place, but why it got worse despite such extensive measures to reverse it. How decisive was the COVID-driven shift to remote learning? Was systemic racism to blame? Conversely, have so-called “anti-racist” policies made things worse? Does the quality of local school management make a difference? What role does the prevalence of poverty, family structure and cultural values play?
As I observed in a recent post, the size of the racial achievement gap varies greatly between Virginia’s 132 school districts — from devastating 30- to 40-point gaps in cities like Richmond and Charlottesville to a handful of districts where Black students out-performed Whites when measured by the SOL reading pass rates.
Instead of dwelling on the disaster zones, which are well known and widely reported, perhaps we should look at success stories where gaps are minimal — indeed, where Black students pass at higher rates than Whites.
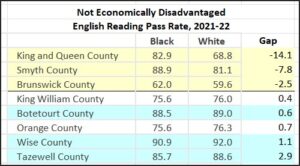
 The table atop this post shows districts with the smallest Black/White pass rate gaps for economically disadvantaged students, while this one shows the districts with the smallest gaps for those who are not disadvantaged (meaning they do not qualify for free or subsidized lunch programs).
In five counties, disadvantaged Blacks out-perform disadvantaged Whites; in three counties, non-disadvantaged Blacks pass at higher rates than Whites.
Sad to say, the five counties where Blacks out-performed Whites do not reflect stellar pass rates for Blacks, but atrocious rates for Whites. Frederick County and Page County have among the lowest pass rates for disadvantaged Whites in the entire state. Do these counties have especially large concentrations of a rural, White underclass? Alternatively, are the school systems just abysmal? Sometimes outliers can tell us a lot. These cases are worth a closer look for someone willing to dig into them.
A similar observation can be made of the three counties where non-disadvantaged Blacks outscored their White peers. Non-disadvantaged Whites in King and Queen and Brunswick fell far short of the statewide average for Whites.
By contrast, I have highlighted (in blue) four counties where Blacks and Whites achieved virtual parity and both groups out-performed state averages by wide margins — Washington, Botetourt, Wise and Tazewell Counties. (Though not highlighted, Smyth County also belongs to this group.) It is not coincidental that all five are located in Western or Southwestern Virginia.
What might those districts have in common? Washington, Wise, Tazewell and Smyth all are located in rural/small town counties in Appalachia; Botetourt is a bedroom community for the Roanoke metropolitan area. Incomes of the first three have incomes below the state average (I’m not sure about Botetourt), and they spend less per student than more affluent school districts. Blacks represent a small minority in each county; likewise, Blacks constitute small percentages of the schools’ student bodies. Politically and culturally, the four localities are all part of culturally conservative “red” Virginia. I would conjecture that the obsession with race that consumes many urban and suburban districts in Virginia’s major metros is less evident here.
Last and not least, all five districts participate in the Comprehensive Instructional Program (CIP) headed by Bacon’s Rebellion contributor Matt Hurt. That program is driven by data, not ideology. (It must be noted that Page County also is a member of CIP. While Blacks out-scored Whites in the English SOLs, both groups under-performed the state average.)
Here’s the safe conclusion: school districts that have participated in CIP long enough to implement its methodology not only out-perform other school districts but have smaller Black-White achievement gaps.
Here’s a more controversial conclusion (more of a hypothesis that requires verification, really): as small minorities in their communities, Blacks have taken on many of the cultural attributes of the dominant White Appalachian culture in which they are immersed. They are more likely than their peers in Virginia’s major metros to be religious, less likely to experience social pathology, and less likely to embrace Black urban culture that rejects “Whiteness” (to borrow a phrase from woke educators).
The two conclusions are not incompatible. Both can be true.
To see the Black and White pass rates for all Virginia school districts, download this PDF file.


