Tag Archives: John Butcher

2019-20 School Year Attendance

by John Butcher

It’s Spring! The Narcissi are standing tall and promising blossoms. The Croci are in flower. Data are sprouting in last year’s Superintendent’s Annual Report.

Table 8, “Number of Days Taught, ADA, ADM,” gives us an early measure of the impact of the pandemic-related shutdowns on school attendance.

The City of Richmond’s end-of-year count of days taught was 120, just two-thirds of the statutory minimum. Richmond’s total was one day more than those of Hampton and Newport News, three days more than Norfolk, and 6.6 days short of the division average.

Continue reading

Counting Teacher Licenses: An Exegesis on Bureaucracy

by John Butcher

An earlier post discussed the remarkably large number of unlicensed teachers in Richmond City public schools, as reported in the 2018 USDoE Civil Rights Data Collection.

An email from the Richmond public schools chief of staff responded that only four of about 2,100 Richmond teachers now are unlicensed, unless you also count 38 whose paperwork is hanging at VDOE because of COVID-related backups.

If true, that would show an astounding improvement in just three years. Unfortunately, it was not true, at least in the sense of the federal data. Continue reading

Watering Down the SOLs. Again.

by John Butcher

If you want to boost the pass rates of the Standards of Learning exams, you have three choices (aside from the one perfected at Richmond’s Carver Elementary): Improve teaching, make the tests easier, or relax the scoring.

On the 2019 revision of the math tests, the Board of “Education” chose the last option: They adopted cut scores in five of six cases that were less than the level necessary to retain the same level of rigor as the earlier tests. The results were predictable (and, of course, fed the false notion that student performance was improving).

The Board now has jiggered the English tests to the same end. The recommendation (teacher-driven; no pretense here of objectivity) was for every cut score to be lower (easier) than the level necessary to maintain the rigor of the tests. Continue reading

More Data on SW VA’s Breakout School Performance

by John Butcher

We have seen that the divisions in SW Virginia (“Region 7” in the VDOE system) formed their own organization, the Comprehensive Instructional Program (“CIP”), that brought nice improvements in student performance.

While we wait to see whether the Board of “Education” will punt on the 2021 SOL testing, I’ve been looking over the 2019 data (there being no tests in 2020). The data for Region 7 paint a lovely picture.

You may recall that, since undertaking the CIP, Region 7 has seen major improvements in the pass rates of its economically disadvantaged (“ED”) students.

Continue reading

Money Don’t Buy You Learning

by John Butcher

It’s December. The Generous Assembly is about to return and the demands for more education funding (see Executive Summary at p.4) resound throughout the Commonwealth.

The data would suggest that these demands are misplaced.

VDOE won’t post the 2020 expenditure data until sometime this spring and there were no 2020 SOLs, so we’ll use the 2019 expenditure and SOL data. The expenditure numbers below are the those for “day school operation” (the sum of Administration, Instruction, Attendance and Health Services, Pupil Transportation, and O&M spending). Student counts are the year-end average daily membership.

One wrinkle: Statewide, “economically disadvantaged” (here, “ED”) students underperform their more affluent peers (“Not ED”) by some 17 to 22 points, depending on the subject. Thus the division average pass rates depend both on student performance and the relative numbers of ED and Not ED students. We’ll avoid that issue here by looking at the rates for both groups.

Here, then, are the division average reading pass rates for the two groups plotted v. the division day school expenditure per student: Continue reading

Bring Back SGPs (Student Growth Percentiles)

I suspect John Butcher was writing tongue-in-cheek when he headlines his latest post on Cranky’s Blog, “Why Do the New Tests Punish the Poorer Kids?” As shown by the graph (left), when the Virginia Department of Education introduced new Standards of Learning (SOL) tests reflecting higher standards a few years ago, average test scores dropped for both students classified as disadvantaged (qualifying for free school lunches) and those not so qualified (referred to as non-disadvantaged). But scores dropped harder and further for the disadvantaged kids. The gap in pass rates between the two groups has increased from around 13 percentage points to about 20. Continue reading

More Money for What?

by John Butcher

The tug-of-war between the School Board and City Council over school funding enters a new era of speculation: Will the recent election results produce more funds for Richmond schools?

That overlooks the more fundamental question: What is the School Board doing with all the money it now is spending?

The most recent data from VDOE are from 2015-16. Here, from that year, are the per-student disbursements by division for Richmond, three peer divisions, and the state average for school divisions. I’ve left out the sums for facilities, debt service, and contingency reserve.

The largest single cost for schools is salaries, so it’s no surprise that Richmond’s excess of $3,051 per student mostly went to the instruction category.

Expressing the Richmond data as differences from the state number, we get:

Or, multiplying those differences by the Richmond enrollment of 21,826:

Multiplying the $3,051 Richmond total excess by the 21,826 enrollment gives the excess Richmond expenditure total: $66.6 million.

We can account for some of that.

The 2016 average salary in Richmond was $51,263 vs. the state average of 56,320. That is, Richmond saved $11.3 million vs. the state average by underpaying its teachers.

At the same time, Richmond has a lot more teachers than average:

At the average salary of $51,263, that comes to an extra cost of $18.5 million.

Combining those data leaves Richmond with an excess cost v. the division average of $59.4 million.

This overlooks the question of what those extra teachers are doing for the RPS students.  To judge from the SOL scores, it’s more a question of what they are doing to the students. Continue reading

School Accreditation Process Violates State Law

Some unfortunate Virginia Department of Education administrator will be tasked with the job of poring through the public responses to proposed rules for granting and denying public-school accreditation. I would pay good money to watch his hair catch on fire when he reads the comments submitted by John Butcher, author of Cranky’s Blog. Here’s how John summarizes the accreditation process:

“VA. Code § 22.1-253.13:3.A provides:

“[The Boar of Education’s] regulations establishing standards for accreditation shall ensure that the accreditation process is transparent and based on objective measurements. …

“The current accreditation process is in wholesale violation of that law:

  • The Board increases pass rates at some high schools based on the performance of students who do not attend those schools;
  • The Board fails to adjust accreditation scores for a major factor known to affect test scores, poverty, and the Board has abandoned its measure of academic progress, the Student Growth Percentile, that is not affected by poverty;
  • The Board’s indifference to misclassification of students as “disabled” and the abuse of relaxed testing procedures for those students continues; and
  • The Board’s opaque and byzantine ‘adjustments’ increase accreditation.”

Read the short version of his comments here. Or read the full and unadulterated version here.

It’s Performance, Not Poverty

by John Butcher

The popular sport in the Richmond “education” establishment has been to blame the kids for the awful performance of our schools. We particularly hear about our less affluent (the official euphemism is “economically disadvantaged”) students.

We have some data on that. Again.

Here are the average reading pass rates by grade of the economically disadvantaged (”ED”) and non-ED students in Richmond and the state.  “EOC” indicates the End of Course tests that generally must be passed to receive “verified credits” that count toward a diploma.

Both in Richmond and on average, the ED group underperforms the non-ED group.

To the point here, the Richmond ED students underperform their peers in the state averages, as do the non-ED Richmond students.

We can calculate the differences between the Richmond groups and state average to measure that underperformance.

Here we see Richmond’s ED students underperforming their peers by about 7% in elementary school while our non-ED students average some 9% below that group statewide.  In middle school the difference increases to roughly 19% for the non-ED students and 25% for the ED group.

The math test results show a similar pattern.

These data tell us two things:

  • Richmond students, both ED and not, underperform their statewide peer groups on average; and
  • The average SOL performance of Richmond students, ED and not, deteriorates dramatically in middle school.

As I have demonstrated elsewhere, the large percentage of ED students in Richmond (64% in 2017) does not explain our low pass rates.  So we are left with (at least) two possible explanations: Either Richmond students are less capable on average than students statewide or our schools are less effective than average.

If Richmond’s students were just less capable, it would explain the low elementary school scores but not the drop in pass rates after the fifth grade.

The plummeting performance of our students when they reach middle school tells us there’s a (big!) problem with our middle schools.  And there’s every reason to think that the school system that has terrible middle schools might also have problems with its elementary schools. Continue reading

Failing to Fix the Unfixable

Cranky (aka John Butcher) is on a tear these days, most recently exposing the Virginia Board of Education’s ineffectual effort to fix the City of Richmond’s broken school systems.

The Richmond’s schools are in turmoil. According to the state board, 27 of the city’s 44 schools are not fully accredited. The school board has booted out the district’s superintendent, who only two or three years ago had been highly touted, for reasons that remain opaque. City and state bureaucracies are moving ponderously to address the deep-rooted dysfunction. But so far, the only product of the teeth gnashing and foot dragging is a “Memorandum of Understanding,” which, in Cranky’s jaundiced eyes, “does nothing but create busy work and a ‘rough draft’ plan that is not a plan.”

Cranky proceeds to dismember the MOU like Jeffrey Dahmer rended his victims. The MOU, he suggests, is vague, redundant, intrusive, and unenforceable. Worst of all, he writes, “VBOE does not know how to fix Richmond’s broken school system. They don’t know what to tell a judge that Richmond should be made to do, so they don’t even contemplate exercising their authority to sue.”

If you want to find yourself laughing and crying at the same time, check out his post.

Mo’ Money Is Not the Answer

by John Butcher

It’s been a while since I sent Jim a bang per buck analysis of school performance. Now that the 2016 SOL data are out, I’ll try to get back in the groove.

In the past I have plotted the raw division SOL pass rates vs. the annual disbursements per student. But comparing bang-for-the-buck between different school systems is a tricky business. We know, for example, that poverty impacts academic performance. As shown in the scatter graph below, economic disadvantage explains about 39% of the variation in 2016 reading test scores.

2016_reading

To level the playing field this year, I’ve adjusted each division’s pass rate to eliminate the effect of economic disadvantage. (I can offer an explanation in the comments, if you’d like to know the details.)

2016_reading_corrected

You might notice that six divisions show corrected pass rates exceed 100%. That is because their pass rates were high in the first instance and considerably higher than their average ED would predict.

That rising tide floats all boats: The adjustment also raises the City of Richmond from an actual 60% pass rate to an adjusted 79%.

As to cost, VDOE will not post the 2016 data until sometime this spring so we’ll have to make do with 2015 data for disbursements per student (using end-of-year enrollment).

On that basis, here are the 2016 division average reading pass rates, corrected for the economic disadvantage of the division’s studentbody, plotted vs. the 2015 division disbursements per student.

2016_reading_adjustment_disbursements

The fitted line suggests a slight increase in score with disbursement but there is no correlation. That is, spending more per student is not correlated with better pass rates. Continue reading

VDOE on School Cheating: It’s Not Our Problem

by John Butcher

We have seen that a former Latin teacher in the Roanoke County Public School (RCPS) system alleged wholesale cheating on non-SOL high school tests in the system. And we have seen that the President of the Board of Education, Billy K. Cannaday, Jr., ducked the issue, responding, in essence, that RCPS is doing something about the cheating… and, besides, the State can’t do anything.

So, of course, I filed a Freedom of information Act request with VDOE for the underlying public records.  The response: A collection of emails and drafts of the Cannaday letter but no report of a serious inquiry into the cheating.

If you’ve ever dealt with the bureaucracy you know that functionaries don’t make a trip to the water cooler without writing a memo to file. Even though Virginia Department of Education administrators handled a letter from the aforesaid Latin teacher, Robert Maronic, largely by word of mouth, they left a paper trail.

Elizabeth – I am going to review the draft letter with Dr. Cannaday over the next two days while he is here for the Board meetings. Can you give me some notes (either written or verbal) that provide more specifics about who you talked with, what they are doing about the concerns, etc. so that I can share those informally with Dr. Cannaday?

  • Morris replied the same day:

Just in case you need it, here is the contact info for the person I spoke with from Roanoke County Public Schools:

Ben Williams
Associate Director of Testing & Remediation
540-562-3900

  • The June 22 Luchau email chain includes a June 20 from Eric Von Steigleder, the Special Assistant for Communications in the office of our Secretary of Education. He wrote:

    FYI ‐ Mr. Maronic wrote a similar letter to our office as well. With input from DOE and our office, I mailed the attached letter to the constituent encouraging him to work with his local Superintendent as well as his school board to address his concerns.

They didn’t produce the “attached letter” but Maronic has provided me a copy:

holton_letter2

Note her response: “I encourage you to share your concerns with your local superintendent’s office as well as your local school board.” (Maronic had brought up the issue to the School Board and Board of Supervisors, but no action was taken.)

So, there you have it: The few records that exist suggest that the VDOE inquiry into Maronic’s charges of widespread cheating amounted to a single phone call by one mid-level VDOE functionary to a mid-level Roanoke school functionary. The Party Line, running up to the Secretary: “Nothing we can do about it.”

Continue reading

The State Department of Superintendent Protection

monkeysby John Butcher

On June 7, I posted a letter to the President of the State Board of Education from a former Latin teacher in the Roanoke County system alleging cheating at one or more schools in that system. That teacher, Robert Maronic, averred “widespread” cheating and claimed to have informed the administration of the problem in November, 2012, the Board of Supervisors in October, 2015, and the School Board in November, 2015.

(Maronic posted an op-ed in Bacon’s Rebellion on the same topic: “Halt the High School Cheating Epidemic.” — JAB)

On June 24, Maronic received a reply (reproduced below) from the President of the Board of Education. Let’s analyze that letter.

Thank you for your letter detailing concerns with the Roanoke County Public School system. I appreciate you [sic] taking the time to contact the Virginia Board of Education.

Just from the first sentence we know this letter is Bad News: President Cannaday characterizes allegations of wholesale cheating as “concerns.”

The [Roanoke County Public School] division informed the Department that it is taking measures to address this issue and is working with outside support to combat this challenge.

So, the Roanoke County division admits to some or all of the allegations:

  • It is taking unspecified “measures.”
  • Those measures will “address,” but perhaps not eliminate the cheating.
  • The division is “working” with outsiders to “combat this challenge.”

What this does not say is that the Roanoke County School Superintendent has eliminated the cheating and fired the people responsible for it.

Pursuant to the Constitution of Virginia, the Board of Education determines and prescribes the Standards of Quality for school divisions, and the supervision of schools in each school division is vested in the local school board.

Hmmm.  Let’s look at authority:

  • Va. Const. art. VIII, § 4:  The general supervision of the public school system shall be vested in a Board of Education . . .
  • Va. Code § 22.1-65:  A division superintendent may be assessed a reasonable fine, suspended from office for a limited period or removed from office by either the Board of Education, upon recommendation of the Superintendent of Public Instruction or the school board of the division for sufficient cause.

We need not parse the scope of “general supervision” to understand that the Roanoke County Superintendent is responsible for what happens in his system.  Either he knew of the cheating and needs to be fired for not dealing with it, or he did not know of the cheating so he needs to be fired for incompetence.

And Cannaday is president of one of the two boards that can do the firing.

Continue reading

What the Virginia “Education” Association Is Trying to Hide

by John Butcher

It’s a strange state we live in. The meetings of our legislators are open to the public; their work product goes in the newspaper and on the Internet. The public is free to evaluate their positions, express opinions, and hold them accountable by voting them in or out of office.

Virginia’s judges perform in open court. Their work product is public and subject to legal review by the appellate courts. Judicial Performance Evaluations based on feedback from attorneys and jurors go to the General Assembly, which has the power to fire judges, and to the public, which can fire members of the General Assembly.

By contrast, the data showing how effectively public school teachers are educating our children are treated as a state secret.

The Virginia “Education” Association says that performance data might let the public make “prejudicial judgments about teacher performance.” They want teacher evaluation to be left to the school systems, which are free to ignore ineffective teaching — and do. So, Virginia parents are deprived of information to evaluate their children’s teachers or even to gauge how school divisions are managing — or mismanaging — inadequate teachers whom parents are taxed to pay.

Brian Davison of Loudoun sued the Department of Education and punched a small hole in this conspiracy against Virginia’s schoolchildren. (See Davison v. Virginia Education Dep’t, No. CL14 -4321; circuit court, city of Richmond, final order, 12 April 2016). Now the Virginia “Education” Association has threatened to sue VDOE, Brian, and me, seeking court orders to prevent, among other things, our disseminating and commenting upon Student Growth Percentiles (SGPSs) and, perhaps, other data regarding teacher effectiveness.

At the outset, this demonstrates that the Virginia “Education” Association is too stupid to count to “one.” The First Amendment bars this attempted prior restraint of our truthful speech.

As well, the information already available provides a window into what the Virginia “Education” Association is trying to hide.

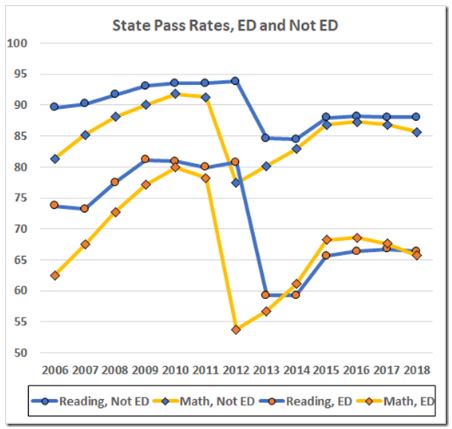
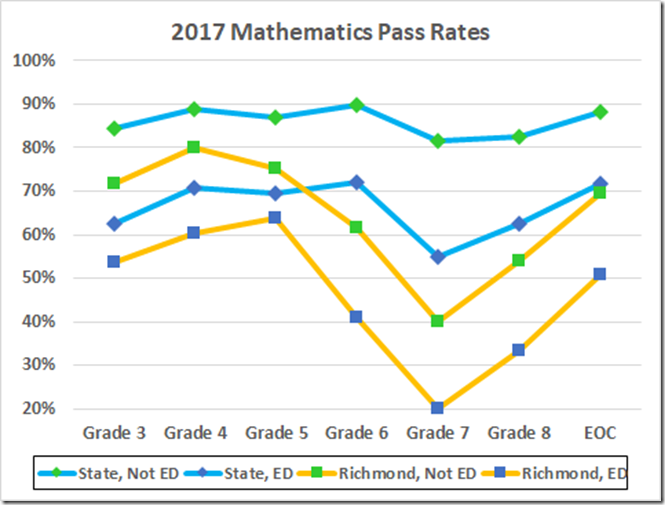
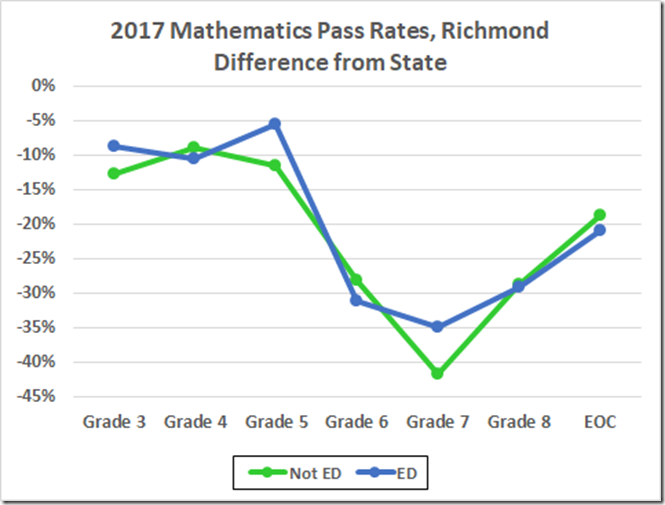
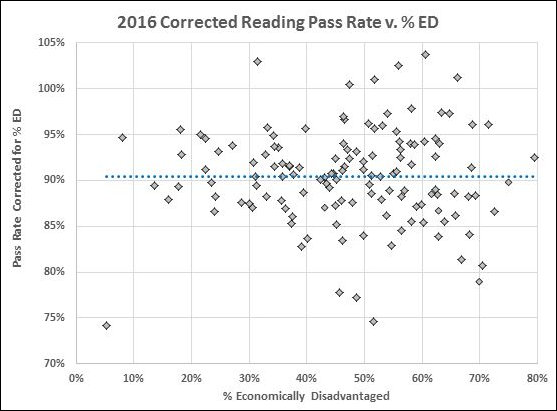
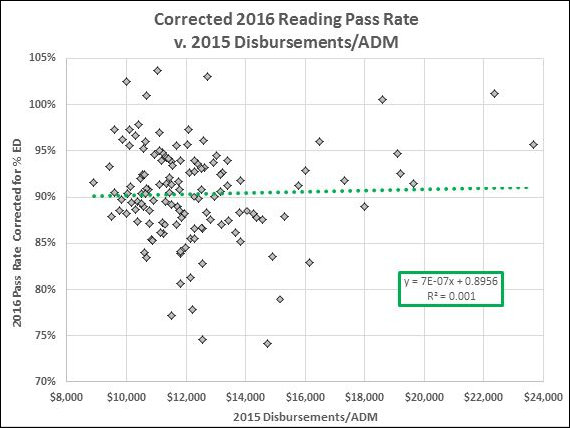
We know that the Standards of Learning are an imperfect measure of teacher performance. The scores go down as there is a strong correlation between SOL scores and the socioeconomic disadvantage of students increase. In contrast, the Student Growth Percentile (“SGP”) provides an indicator of effective instruction, regardless of a student’s scaled score. Indeed, the SGP, which measures improvement, not absolute scores, appears to be insensitive to economic disadvantage.

VDOE calculated SGPs in reading and math for three or four years, ending in 2014. Here are the 2014 statewide distributions of average SGPs by teacher.

2014_reading_math

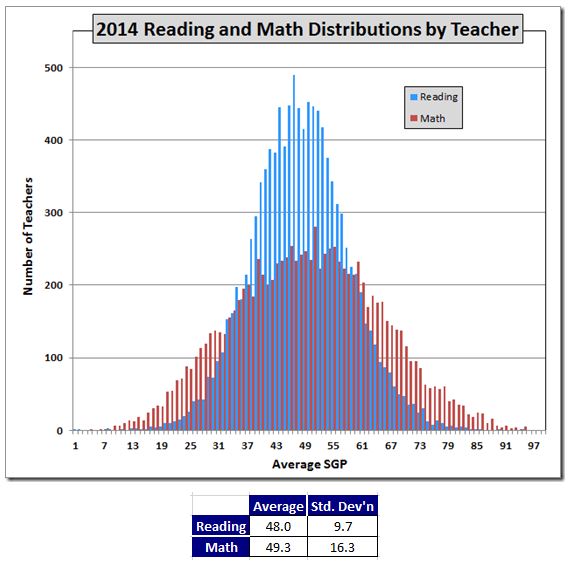
Here we see, as expected, a few very good teachers, a few ineffective ones, and a whole bunch who get average or nearly average performance from their students.

The 2014 data allows us to take a close-up look at individual teachers, albeit with personal identification data stripped away.

Continue reading