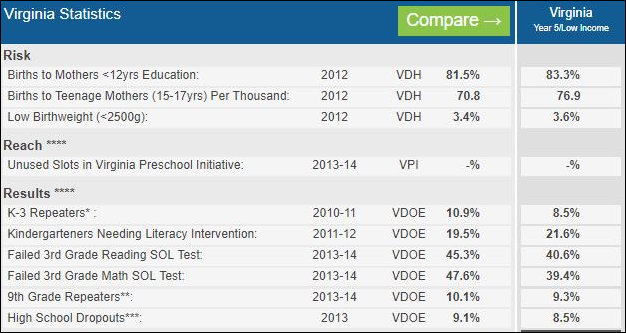
The first column of % figures shows “Year 1” data and the second column shows “Year 5” data for low-income Virginians. Source: School Readiness Report Card searchable database.
The Virginia Early Childhood Foundation has published a new biennial School Readiness Report Card exploring the relationship between childhood risk factors and educational outcomes across Virginia. The Foundation’s big argument, cast cautiously as “one plausible interpretation” of the data, is that recent declines in SOL results can be attributed to a rise in the number of children born into poverty in previous years.
Starting in school year 2013-14, each pool of students taking the PALS-K has included a far greater number of students than in previous years who lived in poverty for their entire first five years of life. This will be true of all succeeding cohorts for the next 5-6 years. … Children with prolonged exposure to poverty are more likely to start school already behind, hence a dip in average PALS-K scores and “Pass” rates, while unwelcome, is not unexpected.
(PALS stands for Phonological Awareness Literacy Screening.)
This interpretation contrasts with the argument I have advanced on this blog that the recent decline in SOL scores coincides with spreading classroom disorder caused by the transition in many school districts from traditional disciplinary methods to a therapeutic approach that consumes teachers’ attention and diverts from time devoted to classroom instruction.
The Foundation’s argument is a not-implausible one. Moreover, I applaud the authors for couching their conclusion as merely “one interpretation” of the data. The authors concede, “It is difficult to make confident assertions regarding the effectiveness and progress of Virginia’s recent school readiness efforts.” I also applaud the Foundation for making accessible data in an interactive database that others can use to reach their own conclusions.
However, I read the data differently, and I invite Bacon’s Rebellion readers to weigh in with their own take on the data.
But first, let’s discuss what we agree on. Poor children comprise a growing percentage of the school population. Poverty is highly correlated with lower levels of educational achievement. Therefore, an increasing percentage of poor children in the schools will be reflected by depressed educational achievement as measured by SOL pass rates. So far, so good.
The authors see the problem as children “living in poverty” for the first five years of their lives. The emphasis on poverty, a measure of income reported to the Internal Revenue Service, as opposed to “living in households headed by mothers with less than 12 years education” implies that a household’s material poverty, or lack of material resources, is the problem. This analysis fails to take into account the vast array of resources that the welfare state provides poor mothers with children.
It is far more productive, I would suggest, to focus on the educational level of the mother. Statewide, the percentage of births to less-than-high-school mothers decreased marginally from 9.7% over the five-year period covered to 9.5%. Among low-income mothers, the percentage increased from 81.5% to 83.3%.
A mother who has failed to graduate from high school is significantly less likely to provide the home environment conducive to early learning — teaching numbers, colors, and ABCs — as a mother who has graduated from high school, college, or an advanced degree program. Teaching ABCs does not require financial resources. It does not require a laptop or high-speed bandwidth. It requires a willingness of the mother to spend time teaching the child things that even poorly educated, low-income women know.
As the economy continues to expand and the job picture improves, creating employment opportunities for even the most unskilled of workers, we can expect to see a decline in “poverty.” However, we don’t know if a decline in poverty may will be matched by a commensurate decline in the percentage of less-than-high-school mothers having children, which I believe is a much more important variable. If the children living in “poverty” level declines but the children living with less-than-high-school mothers does not, I would predict that we will continue to see deteriorating SOL scores.
Another point: the School Readiness Report Card data show declining 3rd grade SOL failure rates in Years 2 and 3, but then increasing failure rates in years 4 and 5. How does the Foundation’s theory account for that abrupt about-face?
The Report Card does not show failure rates for other grades. If we see the same patterns — declining failure rates three-four years ago then suddenly higher failure rates in upper grades in the past two years — then something other than an increase in children born into poverty five years previously must be responsible. My theory would predict that deteriorating classroom discipline would manifest itself in middle school and high school far more forcefully than in elementary school and, therefore, that the decline in SOL scores would be sharper in the upper grades. I have not checked the data, however, so I do not know that to be the case.
While I may disagree with the Virginia Early Childhood Foundation’s conclusions, I appreciate its willingness to publish the data behind its report and the authors’ caution in drawing hard-and-fast conclusions.


