

Standards of Learning (SOL) pass rate for English, 2017-18. Source: Virginia Department of Education
 by James A. Bacon
The Northam administration’s education equity initiative declares that “equity” will have been achieved when outcomes can no longer be predicted on the basis of race, gender, zip code, ability, socioeconomic status or languages spoken at home. The administration does not acknowledge it, but there is a region of Virginia that has largely achieved educational equity — the last place in Virginia that the anti-racist progressives running the Virginia Department of Education (VDOE) would look. But the evidence is right there in its so-called “road map to equity,” “Navigating EdEquityVa.”
I am, of course, referring to far Southwest Virginia, which is, electorally speaking, the reddest region of the state — the religious, culturally conservative, gun-clinging, Trump-voting economic backwater of Appalachia.
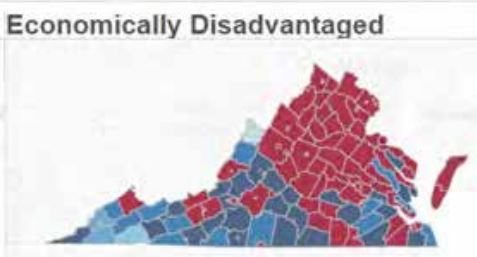
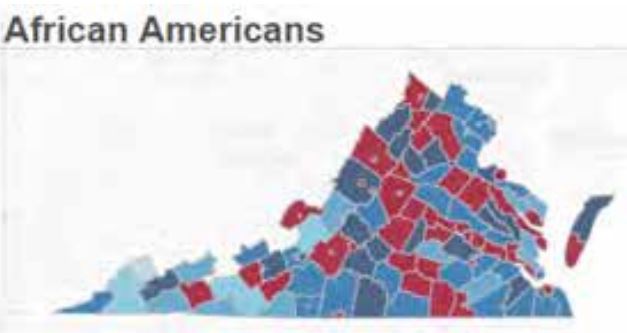
In this post I replicate several maps taken from the EdEquity manifesto. The maps are tiny in the VDOE document, so they become blurred when I blow them up to a size where they can be interpreted. While the graphics are fuzzy, the conclusion is crystal clear. Students in Southwest Virginia school systems, among the poorest in the state, pass at higher rates than any other region of Virginia. That holds true not just for demographically dominant whites, but African Americans, Hispanics, the economically disadvantaged, English learners and students with disabilities.
Perhaps Southwest Virginia schools are doing something right — something that bigger, better resourced, more “progressive” school systems in Virginia’s major metropolitan areas are not. Here’s a hint: SW Virginia school districts focus on what works, not implementing leftist ideology.
The map at the top of this post shows the Standards of Learning pass rates for economically disadvantaged students in the 2017-18 school year for mathematics. Why do I focus first on the economically disadvantaged? Because analysis shows that 50% to 60% of the variability in average SOL pass rates between school districts can be attributed to the socioeconomic status of the students’ families. Children in affluent households enjoy significant advantages stemming from having parents who read to their them, employ a wide vocabulary, set higher education expectations, and have the resources to provide educationally enriching experiences. One of the most meaningful measures of a school system is how well they do helping economically disadvantaged students master the concepts and bodies of knowledge needed to function in contemporary society.
A glance at the map atop this pos tshows how well Southwest Virginia students out-perform the rest of the state in math. Here is the comparable map for SOL English scores:
Same pattern as in math. Students in Appalachia may speak with a distinctive accent that it is still fashionable in some quarters to ridicule, but they kick everybody else’s butt in readin’ and ‘ritin’.
Perhaps the region is successful, some might theorize, because the students are mostly white, and as all right-thinking people know, whites enjoy a special privilege in our society. (Yeah, right, tell anyone from Appalachia how privileged they are, and see how they react.) But such a theory flies in face of the inconvenient fact that African Americans and Hispanics out-perform their Virginia peers in math. (The record is spottier for English SOLs).
Mathematics SOL pass rate for African-American students, 2017-18 school year.
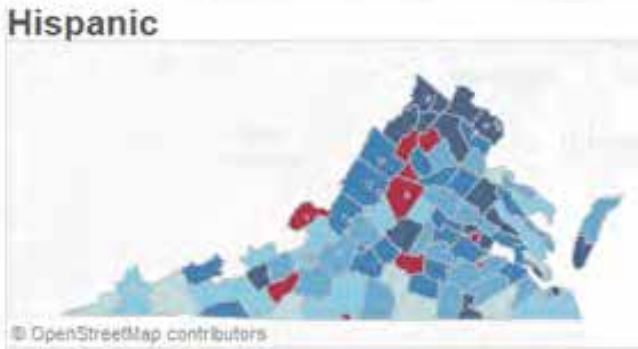
Mathematics SOL pass rate for Hispanic students, 2017-18 school year.

Mathematics SOL pass rate for English learners, 2017-18 school year.
We all know the stereotype of rural, Trump-voting hillbillies as racist rednecks who drive pickup trucks and fly Confederate flags. Blacks and Hispanics in Southwest Virginia may have few teachers who “look like them” and schools may not have reframed their curriculum to be culturally inclusive (both parts of the EdEquity catechism), but they still generally out-perform their peers in the rest of the state.
So, what accounts for the difference? What is Southwest Virginia’s special sauce?
Here’s my hypothesis. The schools focus on what works. Bypassing the educrat establishment in Richmond, schools have banded together in the Comprehensive Instructional Program. Using SOLs as a measure, they identify the teachers whose students show the most progress. They study how those teachers teach, and they communicate best practices to other teachers. As it turns out, success at teaching and learning has almost nothing to do with race or ethnicity, nothing to do with the color of teachers’ skin, nothing to do with culturally relevant pedagogy, and nothing to do with acknowledging white privilege and racism.
Poor schools in Southwest Virginia don’t have the luxury of indulging in elite preoccupations with race and social justice. They have no appetite for turning their schools into petri dishes for progressives to test their theories. As I’ve observed in past posts, many rural schools, especially rural schools in western and Southwestern Virginia, have managed to keep their schools open while riding out the COVID-19 epidemic. They just do what schools are supposed to do — teach. I expect the 2020-21 SOL results will tell the tale.

