
by James A. Bacon
It is widely acknowledged by every serious (and not-so-serious) student of the racial performance gap between whites and African-Americans that half or more of the difference can be explained by socio-economic status. Whites come from more affluent families on average, and they enjoy the benefits that come from affluence, not the least of which is growing up in an intact family household where the adults themselves are well educated and have more money to lavish on their children.
But roughly half the variation cannot be explained by socio-economics. I have raised the possibility on this blog that different ethnic groups have different cultural attitudes towards education (pretty indisputable when it comes to the superior performance of Asians). But school divisions’ approaches to education might be a factor as well. One could hypothesize that school boards and administrators in more politically conservative localities would have a different approach to education — to pedagogy and student discipline, say — than their counterparts in more ideologically liberal districts.
I came to this question by way of a blog post on Taki’s Magazine, “Crevasses in the Classroom,” (hat tip: Andrew Roesell), which took a look at data published by the Stanford Education Data Archive. The Stanford scholars use the data to document and explain the gaps in white-black and white-Hispanic academic performance (though curiously, not the Asian-white gap), and, as expected, found that socio-economic differences explain much but not all of the difference.
In Taki’s Magazine, Steve Sailer rummaged through the database and found that school districts with the most extreme disparities in performance tend to skew heavily to the left side of the ideological spectrum. The greatest gap in the country occurs in none other than the People’s Republic of Berkeley, California, where the median black student would score at only the 5th percentile if he were white. How could that be? Sailer’s explanation:
One exacerbating factor might be that Berkeley’s schools have traditionally been run according to progressive education fads insisted upon by white leftists. For example, the Gates Foundation gave a million dollars to Bill Ayers’ brother Rick Ayers, another ’60s radical ex-fugitive, to work his “small learning communities” voodoo upon Berkeley High School, with an unsurprisingly disastrous impact on math test scores.
Frustrated black parents in Berkeley have at times organized protests in favor of “back to basics” education for their children.
The second worst disparity, says Sailer, is in Chapel-Hill Carrboro, home of the University of North Carolina; the third is in Shaker Heights, the “famously liberal” suburb of Cleveland”; the fourth in Asheville, N.C., “the arts and crafts capital of America, which attracts gays and polite white-flight types”; and the fifth in Evanston, Ill., home to Northwestern University.
The theory sounded plausible, but anecdotal. So I decided it to test it with some Virginia data taken from the Stanford Education Data Archive. (My apologies to Stanford for any abuses that I may have subjected the data to.) Since my goal was to do a quick-and-dirty analysis for purposes of a blog post, not an academic treatise, I looked only at Stanford’s 4th grade English language disparity. A more comprehensive look would entail running correlations for other grades and doing math scores as well. Also, readers should note that the data set I drew from encompassed only 78 of the state’s school districts, so it is not complete.
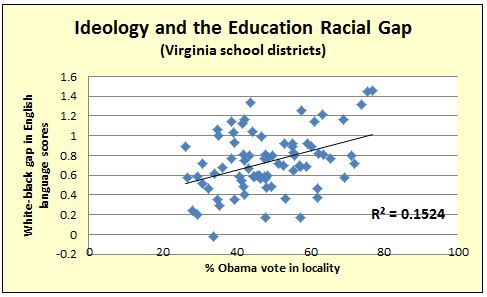
I could think of no readily available metric that measures the ideological proclivities of school boards and school administrations. As a proxy, I took the percentage of voters who voted for Barack Obama in the 2012 presidential election, reasoning that the priorities and sentiments of a more liberal-Democratic leaning electorate would be reflected in the election of local school board officials, the appointment of school administrators and the approach to education generally.
The findings from this one admittedly superficial analysis, seen in the chart above) seem to confirm Sailer’s reasoning. Approximately 15% of the variability in white-black academic performance in the 4th grade can be explained by the political inclination of the electorate and, by implication, the ideological proclivities of the school districts.
Now, I’m not prepared to draw hard-and-fast conclusions from just that one data sample. I’d like to take a much more comprehensive look. But the preliminary findings suggest that such an effort would be worthwhile.

