
 Last week I posted a map showing the wide variability between school districts in the rate at which economically disadvantaged students passed the Standards of Learning (SOL) for English reading. By comparing students from comparable socio-economic backgrounds, I suggested that that some schools do a better job of teaching disadvantaged students than others. But any conclusions were preliminary because any analysis, it can be argued, needs to be adjusted for such factors as, say, spending per pupil, concentrations of poverty, or the prevalence of English-as-a-Second-Language (ESL) students in the school districts.
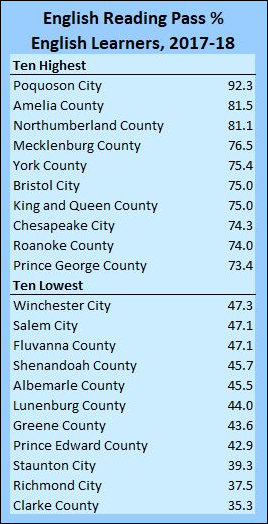
As follow-up, I present the map above showing the wide variability in the rate at which ESL students pass the English reading SOLs. School districts with the highest pass rates out-perform the schools with the lowest pass rates by a two-to-one margin.
Again, this data, drawn from the Virginia Department of Education, is consistent with the notion that some school systems do a better job than others. But it’s important not to draw any hard-and-fast conclusions. I can think of a number of reasons that might explain the variability. School districts that teach English learners from multiple ethnic backgrounds may be more difficult to teach than ESLs who all speak the same language, such as Spanish. Some schools might have higher concentrations of ESLs than others. Schools might vary in the percentage of ESL students who come from disadvantaged households.
Bacon’s bottom line: Think of this data as a starting point for asking more probing questions.
Cry for help! I’m using Datawrapper software, but I can’t get the map to display the name of the locality or the numerical value when the cursor moves over the locality. Online tutorials don’t help. Obviously, I’m doing something wrong. If someone out there knows how to use Datawrapper, please help!

