I spent some time yesterday discussing the Virginia Department of Education’s revisions to school climate surveys. If VDOE returns to the valid, older survey, results could be applied profitably to updating the Learning Climate section of the department’s School Quality Profiles.
Right now, that section contains only historical artifacts of the learning climate, not predictive ones. Learning Climate data include chronic absenteeism, suspensions, expulsions, free-and-reduced meal eligibility, and, for some unknown reason, five-year-old Civil Rights Data Collection data.
The Authoritative School Climate Survey (ASCS), that I have urged VDOE to resume using, has multi-question scales that describe the views of students and staff towards the school.
The data collected from ASCS are more useful than legacy attendance, discipline and poverty data because they are
- more thoroughly descriptive;
- predictive; and
- actionable.
We’ll examine how.
Virginia’s School Quality Profiles as described by VDOE
provide information about student achievement, college and career readiness, program completion, school safety, teacher quality and other topics of interest to parents and the general public.
But not as well as they can.
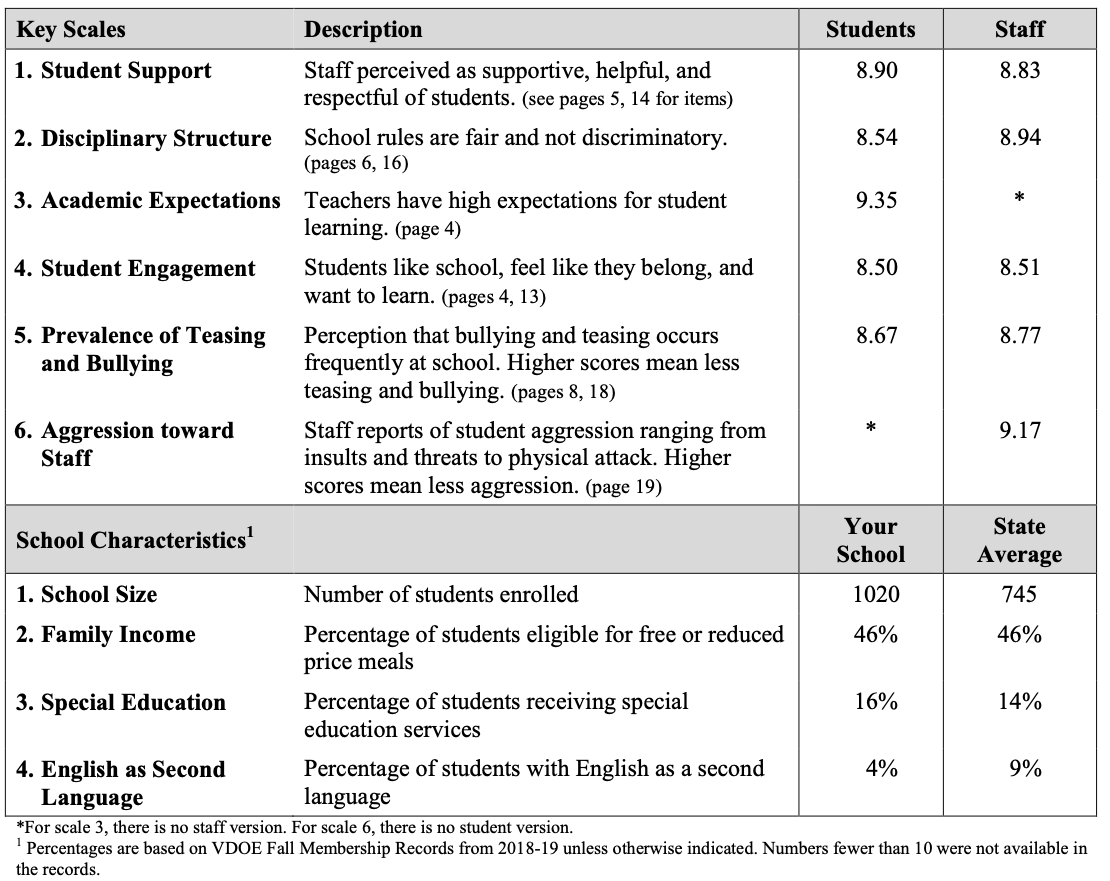
Troubled School. Here is an example of a troubled middle school in a 2019 ASCS survey. Scores display deviations from a mean of 10. Scores significantly lower than 10, as in the example below. show a troubled school.
In this school, both students and staff were pessimistic in 2019 about the school climate.
They proved predictive.
- In 2020-21 chronic absenteeism in this school was 29.6%.
- In 2021-22, the reading SOL results in this school showed a 51% pass rate, math SOLs a 29% pass rate.
Those results also show the principal and division superintendent what needs work, starting with student engagement and disciplinary structure.
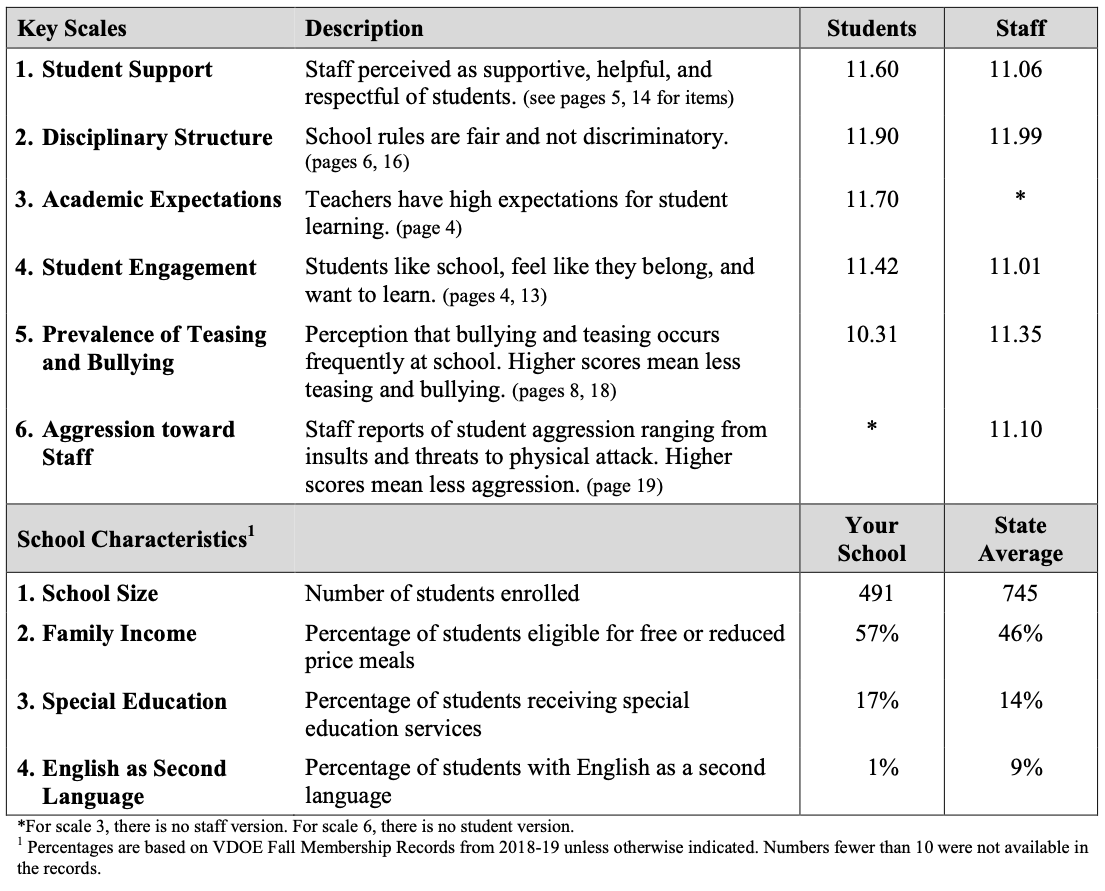
Successful school. Here is a far better 2019 ASCS survey result from a different middle school and different division.
This school has lower family income levels than the one above, but students and staff both expressed far more optimistic views of the school.
They also proved right.
- In 2020-21 chronic absenteeism in this school was 14.7%
- In 2021-22, the reading SOL results in this school showed an 87% pass rate, math SOLs a 92% pass rate.
Bottom line. Those 2019 ASCS survey results were predictive of performance during and after COVID. Both describe the two schools’ learning climates far better than the information in current school quality profiles, and the results are actionable.
I could have provided hundreds more that showed the same utility.
I recommend the addition of ASCS results to the School Quality Profiles.
One way to soothe the pain for the schools falling short is to show progress from the previous survey, even if the results, expressed as deviations from the mean, are still below average.


