
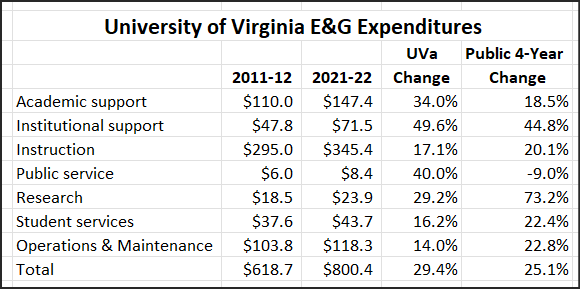
Inflation-adjusted percentage increase of UVa E&G expenditures (in millions of dollars) compared to those of all 15 Virginia public four-year higher-ed institutions.
by James A. Bacon
Always alert for opportunities to arm the University of Virginia Board of Visitors members with statistics they don’t see in their board presentations, The Jefferson Council presents the table above, compiled from data published by the State Council of Higher Education for Virginia (SCHEV).
The takeaway: UVa boosted overall E&G (educational & general) spending faster than Virginia’s other public four-year colleges and universities between fiscal 2011-12 and fiscal 2021-22, but UVa funds were more likely to flow to faculty and staff and less likely to go to student instruction, student services, or research support.
E&G expenditures represent spending on an institution’s core educational mission. Under SCHEV’s accounting methodology, E&G strips out spending on athletics, dormitories, food service, and auxiliary enterprises. The Council’s data portal adjusts for inflation over the 10 years displayed above, so these figures reflect real spending, not funny money.
SCHEV breaks down E&G expenditures by seven broad categories so the public can get a clearer idea of where the money is going. The data are consistent with the interpretation advanced by The Jefferson Council in previous posts that UVa has experienced excessive growth in administrative overhead.
Academic Support. SCHEV defines “academic support” as activities associated with libraries, museums and galleries, audio/visual services, computing support, ancillary support, academic administration, personnel development, and course and curriculum development, and all other subprograms. Ranked by spending, it is the second largest of the seven categories SCHEV tracks.
UVa spending in this category jumped 34% over the decade to $174 million, significantly faster than the 18.5% rise for Virginia’s 15 public four-year institutions as a whole. The surge, nearly double the state average, occurred mainly between 2011-12 and 2017-18 during Teresa Sullivan’s tenure as president. Spending during President Jim Ryan’s time in office rose only slightly greater than the state average.
Institutional Support. SCHEV defines “institutional support” as activities associated with executive management, fiscal operations, general administrative services, logistical services, and public relations and development. This category largely reflects spending by the president and his/her direct reports. When most people think of “administrative overhead,” they’re thinking of institutional support (although there is plenty of administration embedded in the other categories).
UVa spending leaped by 49.6% over the decade to $71 million, making it the fastest-growing E&G category of all. Spending by Virginia’s other public four-years boomed as well, but by a smaller margin. Notably, UVa’s 7% spending increase in this category during the last six years of the Sullivan era was restrained compared to the 40% boom during the first four years of the Ryan era. The Board of Visitors is well advised to ask where this added sum — $20 million — went.
Instruction. SCHEV’s definition of “instruction” goes to the heart of the educational mission. Encompassing general academic instruction, remedial instruction, vocational education, and community education, instruction is the largest of the spending categories — $345 million at UVa. Spending increases in this category (17%) lagged the statewide average (20%).
Most notably, spending on instruction surged during the six Sullivan years by almost 44% but tumbled 19% under Ryan. The decline under Ryan far exceeded that of the 2.4% drop in the state average during the same years. Again, the Board might ask precisely where Team Ryan made its cuts.
Public Service. SCHEV’s definition of “public service” includes a wide array of community services, agricultural extension services, community development, and other community-facing activities. It is also the smallest and least consequential of the spending categories. UVa boosted spending on this category by 40% over the decade, compared to a 9% decline overall, but the sum total was only $8.4 million.
Research. SCHEV defines “research” as activities associated with institutes and research centers, individual or project research, and research relating to agriculture and forestry, coal and energy, environment and water resources, industry and economic development. It should not be confused with the kind of grant-funded Research and Development that takes place in medical schools, engineering schools and other tech-intensive fields.
Research is one of the smaller spending categories, totaling only $24 million at UVa in 2021-22. Research expenditures increased 29% at UVa during the decade, less than half the 73% rate for Virginia’s four-year colleges collectively. As with “instruction,” this category soared during the Sullivan years (up 96%) but was cut back under Ryan (down 34%.)
Student Services. SCHEV defines “student services” as student-services administration, social and cultural development, counseling and career guidance, student admissions and records, financial aid administration, and student health services. UVa’s student services expenditures totaled $44 million in 2021-22.
Over the 10-year period, spending for these student-facing programs at UVa amounted to 16%, trailing the 22% increase for four-year colleges as a whole. The overwhelming majority of UVa’s increase took place during the Sullivan years. Spending rose less than $1 million under Ryan. The Board of Visitors might inquire where those cuts occurred and how students might have been impacted.
Operations & Maintenance. SCHEV defines “operations & maintenance” as activities — administration and supervision, custodial service, building repairs and maintenance, grounds maintenance, energy and utility costs, liability insurance, property rentals, and debt service – associated with the buildings & grounds. At $118 million, it is UVa’s third-largest E&G budget category.
Spending in this category increased 14% over the ten-year period, less than the 23% for Virginia’s four-year colleges as a whole. What increase occurred did so entirely during the Sullivan years (up 24%); spending declined during the Ryan years (down 8%). Board members might inquire whether this decline represents laudatory economies and efficiencies under President Ryan or is attributable to some other factor such as the retirement of debt. Given the building boom currently underway at UVa, they also might ask if the university is adding assets that will jack up future maintenance obligations.
These numbers should not be taken at face value. They are a starting point for asking informed questions. Among other matters, Board members should investigate whether changes in the numbers represent a shuffling, or reclassification, of data from one category to another. They might ask if the numbers are affected by outsourcing to outside contractors. According to SCHEV data, for instance, UVa’s use of “contractual services” rose from $126 million to $136 million during the Sullivan years, and then ballooned to $209 million under Ryan.
The Board never gets an opportunity to ask the questions raised here. It is not the Board’s job to micro-manage the budget, but it the Board’s job to set priorities. Board members should press for details and insist upon explanations.

