In 1960 the percentage of Americans receiving disability Social Security disability payments amounted to 0.65 of the 18-to-64-year-old population. In the intervening half century, work has become more automated and less strenuous. The quality of healthcare has improved. Yet the percentage of the working-age population on disability had grown to 5.6% — nearly nine times.
Clearly, something is at work in American society to lower the standards of what constitutes “disability.” One factor at work: Nearly half of all Americans on disability profess to suffer from “mood disorders” or “musculoskeletal” problems. For all practical purposes, it is impossible to disprove that someone experiences depression or a bad back.
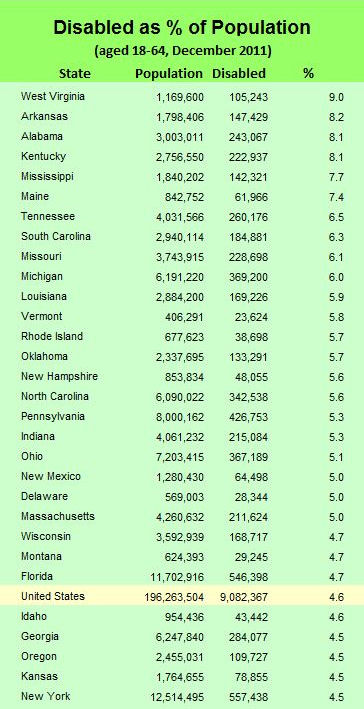
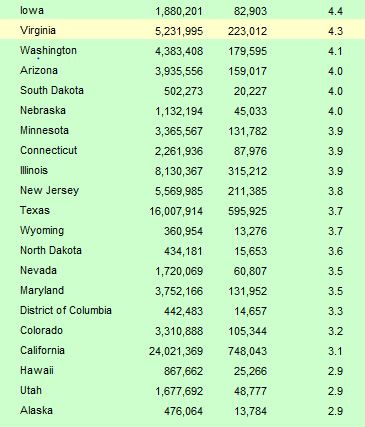
Having read that disability benefits are easier to qualify for in some parts of the country than others — West Virginia is notorious for having sympathetic administrative law judges — I thought I’d see whether the prevalence of citizens on disability varies significantly by state. Turns out that it does. Here is the breakdown for December 2011.
The disability rate for Virginia is slightly below the national average, which says something, but I’m not sure what. In examining the regional variation of disability rates, the most remarkable thing I have found is that states south of the Mason-Dixon Line have the highest rates — West Virginia has the highest rates by far — while states in the West (including California) have the lowest.
Is this a cultural phenomenon? Do those welfare-hating Southerners have a soft spot for people with disabilities? Or does the variation reflect something else, such as differences in worker compensation laws? If it’s tough to get workers comp, perhaps people are more inclined to seek disability benefits. If anyone has any thoughts, please voice them in the comments.
— JAB


