
Click image to enlarge.
by James A. Bacon
Over the past several days I have been highlighting how public schools in Southwest Virginia have bucked the statewide trend of declining standardized test scores. While the Northam administration has implemented a top-down “social justice” approach, a consortium of rural Southwest Virginia schools has embraced a totally different strategy: (1) identifying the most successful teachers across the region; (2) sharing their instructional materials and other best practices; (3) measuring results and incorporating feedback, and (4) raising expectations.
John Butcher, the author of Cranky’s Blog, has done some follow-up numbers crunching to show just how effective Southwest Virginia’s Comprehensive Instructional Program (CIP) has been at lifting the Standards of Learning pass rates of economically disadvantaged students — the very same demographic the social-justice crowd wants, but has failed, to help.
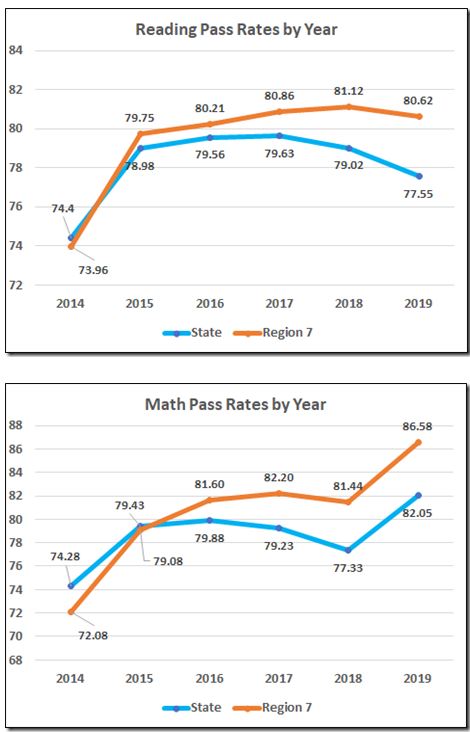
The first two graphs (above) show how the reading and math SOL scores, which were at rough parity with statewide averages in 2014, have zoomed ahead of the pack.
As is universally acknowledged, better-off students (classified in state data as “non-economically disadvantaged”) out-perform economically disadvantaged students in SOL pass rates by a wide margin. The data above don’t tell us whether the improvements in Southwest Virginia are occurring across the board, or primarily among better-off students, or primarily upon economically disadvantaged students. So Butcher dug a little deeper.
Click image to enlarge.
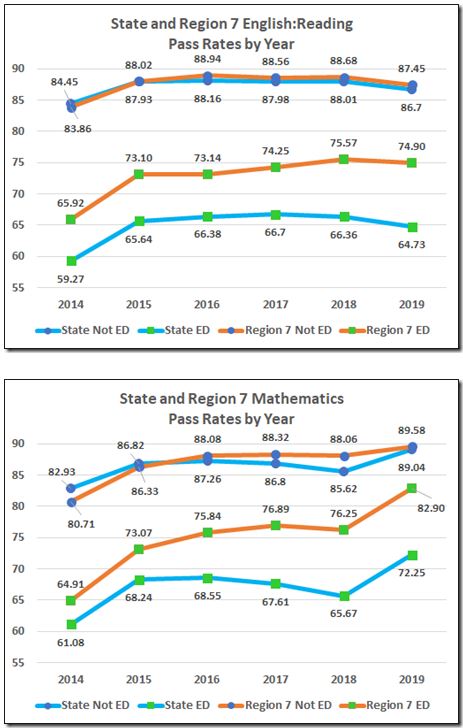
These graphs compare the reading and math SOL pass rates of better-off students and economically disadvantaged students in Southwest Virginia and for Virginia as a whole.
The pass rates for the better-off students is almost identical to the state average.
But the pass rates for economically disadvantaged students in Southwest Virginia, which was superior to the statewide pass rates to begin with in 2014, has grown considerably wider. The difference in math scores has been dramatic.
Bacon’s bottom line. If your goal is to help economically disadvantaged students master the skills they need to progress through and graduate from public schools, then Virginia as a whole needs to be doing more of what the Comprehensive Instructional Program is doing and less of what is coming down from the Virginia Department of Education in Richmond. It is noteworthy that the CIP consortium has expanded beyond its base in Southwest Virginia (educational Region VII) as other rural school districts across the state have opted in with their own funds.
Essentially, we have two approaches to educational reform in Virginia today:
- Model A: A bottom-up approach of sharing best-practices as identified through data analysis. (CIP)
- Model B: A top-down approach of imposing solutions informed by “Progressive” social-justice dogma. (Northam administration, City of Richmond, Fairfax County).
In the past I have predicted that the consequence of Northam administration’s focus on “social justice’ would be seen in declining standardized test scores, particularly among the groups (blacks and Hispanics) who are the intended beneficiaries but, in fact, are the unintended victims. With this data, we can refine our predictions. The gap in SOL pass-rate trend lines will widen between school districts that embrace Model A and Model B.

