by James A. Bacon
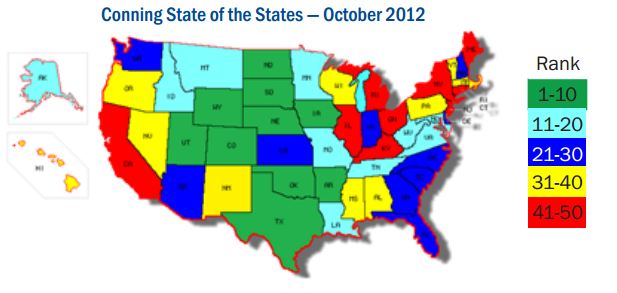
Virginia may be holding onto its sterling AAA credit rating, but global asset manager Conning & Co., gives it a so-so No. 12 credit ranking in its latest State of the State report. For reasons not explained in the white paper, the Old Dominion fell from a No. 6 perch in April.
Conning’s methodology incorporates both measures of fiscal strength and economic vitality on the grounds that strong economic performance lifts tax revenues and strengthens government finances.
The highest-ranking states are North Dakota and Wyoming. Most of the states in the top 15 are located in the Great Plains or the Rocky Mountains, beneficiaries of the boom in energy and agriculture. Virginia stands out as the top-ranked state possessing small energy and agricultural sectors. For what it’s worth, most of the most credit-worthy states embrace the Red State governance model of limited government. Not surprisingly, the bottom-ranked states embrace the Blue State governance model: California, Rhode Island, Illinois, Ohio, New York, New Jersey and Connecticut at the very bottom.
Based partially on Conning’s research, Forbes Magazine has published a list of 1o “death spiral” states, which also takes into account the ratio of “takers” (public employees, pensioners and welfare recipients) versus “makers” (taxpayers). This methodology scoops up some deep-South red states. The list of death spiral states includes: New Mexico (with the worst taker-maker ratio), Mississippi, California, Alabama, Maine, New York, South Carolina, Kentucky, Illinois, Hawaii, and Ohio. Nice to know that Virginia’s not on that list!
Here are Virginia’s scores broken down by Conning’s credit indicators:
Laffer State Economic Competitiveness Ranking … 3
Economic debt to personal income … 18
FY12 General Fund balance % of expenditures … 27
Debt per capita … 30
Tax revenue growth … 20
Expenditure burden… 35
5-year Gross State Product growth (2006-2011) … 20
Unemployment rate, August 2012 … 10
Year-over-year employment growth, Aug. 2012 vs. Aug. 2011 … 23
Population growth 2000-2011 … 16
Per capita income … 8
Year-over-year home price change, period ending 6/30/2012 … 29
Foreclosure rate, Aug. 2012 … 23
It is not evident from Conning’s narrative why Virginia fell so precipitously in the rankings. It’s possible that the report does not take into account 2012 legislative reforms to the Virginia Retirement System. A graphic in the Conning report indicates that Virginia’s retirement system is only 72% funded. But the most recent Pew Center for the States analysis indicated that the VRS is 80% funded. Another possible explanation is that Virginia’s economy has received little lift from the boom in oil, gas and agricultural commodity prices. Indeed, Virginia’s coal industry has taken some serious hits as electric utilities shift from Appalachian steam coal to natural gas.
Of course, it wasn’t too long ago that today’s leaders looked like perpetual laggards. Commodity prices go boom, then they go bust. Virginia’s economy is largely insulated from that cycle. The Old Dominion may not be the shining fiscal and economic star that we like to think it is, but it’s not doing so badly, all things considered.


