
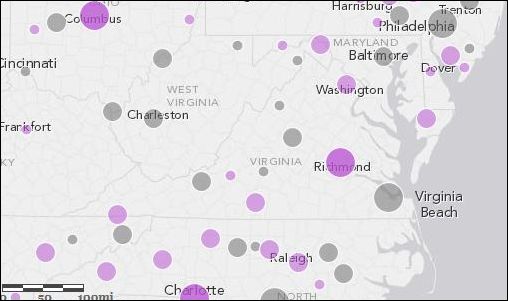
Exerpt from map published in CityLab. Purple = net in-migration. Gray = net out-migration.
by James A. Bacon
Richard Florida’s latest demographic research project presents an interesting twist on the old “domestic migration” data we’ve all seen (well, we’ve all seen it if we’re regular readers of Bacon’s Rebellion!) The U.S. Census tracks “domestic migration” — the movement of American citizens from one locale to another — and commentators have made much of the fact that some metros are consistent population losers while others are consistent gainers.
While the migration data is useful, there is much it doesn’t tell you. It’s one thing if your region is seeing an influx of college grads and Ph.Ds and quite another if you’re getting flooded with high school drop-outs. Florida broke down the migration data by education level to determine which metros were enriching their human capital, which metros were diluting their human capital and which were simply exporting their human capital. You can see his presentation at CityLab.
In some ways, the data presents the same picture. Big Northeastern and Midwestern cities like New York, Chicago, Philadelphia and Detroit lost population across all education categories between 2011 and 2012. But other cities showed more complex patterns. The Washington and San Francisco metros saw a net in-migration of people with college degrees and advanced degrees and a net out-migration of the less-than-college educated. Not a bad trade — you gain the people who contribute the most to the economy and tax base and you shed people the most likely to wind up on food stamps and unemployment insurance!
Here are the details for Virginia MSAs. Take the numbers for Charlottesville, Blacksburg and Harrisonburg with a grain of salt. Their massive outflow of college grads and Ph.D.s undoubtedly reflects the outsize demographic impact of local universities — hundreds of students come in with high school degrees and leave with sheepskins.
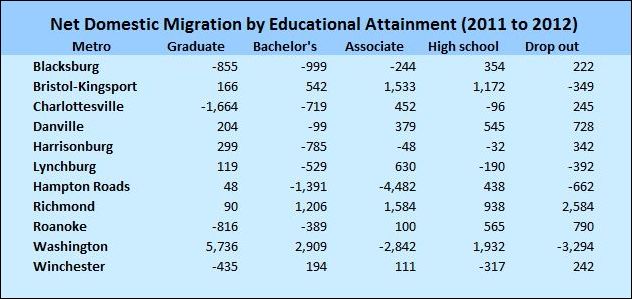
Richmond saw the greatest net in-migration of any Virginia metro during this period, although the newcomers were a mixed bag educationally. The region saw a bigger influx of people with less-than-high-school education levels than college and post-graduate combined. Roanoke experienced what can only be called a brain drain — no, make that a brain hemorrhage — losing large numbers of educated residents while receiving equally large numbers of ill-educated citizens.
This data is fundamental to economic development. Political and civic leaders need to know not only how many people are coming and leaving but what their net education level is — whether the region is building human capital or seeing it shrink. Each region needs to track this data over time. And, if it wants to have any kind of future in the entrepreneurial knowledge economy, it needs to attract citizens with the highest level of education who are likely to contribute the most to the economy.
The prognosis from this one year’s worth of data is not good for downstate Virginia. Throwing out the figures for Bristol-Kingsport (which is mostly Tennessee) and the three college towns, I conflated results for Hampton Road, Richmond, Roanoke, Lynchburg, Danville and Winchester. Here is the composite tally:

That’s just one year but it looks like a major brain drain to me. We should be terrified. But we’re not. We should feel a sense of urgency. But we don’t.

