
Source: “Repair Priorities 2019
A new study by Transportation for America and Taxpayers for Common Sense documents the magnitude of the “Growth Ponzi scheme” in the U.S. road transportation system. Between 2009 and 2017, the 50 states collectively added more than 223,000 lane miles to their road networks. At an average cost of $24,000 per lane mile to keep roads in a state of good repair, that means states and localities have pumped up their maintenance liabilities by $5 billion a year.
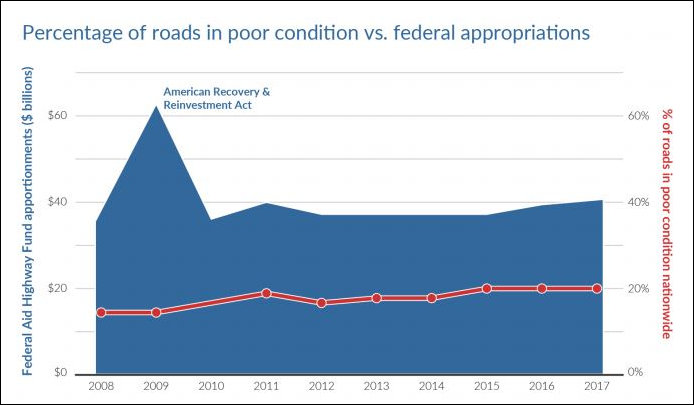
But the states aren’t keeping up with those costs, contends “Repair Priorities 2019.” Nationally, the percentage of roads in poor condition increased from 15% in 2008 to 20% in 2017.
The problem isn’t a lack of money, argues Beth Osborne, director of Transportation of America. “We’re finding the money for expansion. There’s too little money to do everything, but we’re insisting that we do everything.”
The federal government subsidizes the up-front cost of building new roads, highways and bridges. States jump at the chance to get this “free” money from Uncle Sam. In a parallel phenomenon first explained by Charles Marohn, leader of the Strong Towns movement, localities reap short-term gains in tax revenue from new real estate development, while real estate developers offset some of the up-front cost of building the attendant road improvements through proffers and impact fees. But developers do not pay for the ongoing cost of maintaining and operating the road network (and neither does the federal government). As road systems age, liabilities mount, and local governments spur more development to generate revenue to recoup those costs. And so the Ponzi scheme continues until it falls apart.
The “Repair Priorities” study documents the growth in road-miles and the increasing liabilities associated with that growth, as well as the failure of state and local governments to maintain those roads. As the report summarizes, “Despite more spending, our roads are not getting better.”
Quoting directly from the report:
$169 billion per year just to keep our good roads “good.”
As of 2017, we would need to spend an estimated $168.6 billion per year exclusively on road repair just to preserve the nation’s roads that are currently in good and fair condition in that acceptable state through routine pavement management practices.
$63 billion per year on top of that to address the backlog of poor roads.
We are also facing a substantial financial burden to bring the backlog of roads currently in poor condition into good repair. It is significantly more expensive to rehabilitate roads that have fallen into poor repair than to preserve roads in good condition on an ongoing basis through routine pavement preservation. We
estimate that the total cost to bring the nation’s current backlog of roads in poor condition into good repair is approximately $376.4 billion, or $62.7 billion per year over a six-year federal transportation bill.
Taken together, this means we are currently facing a total need of $231.4 billion per year just to keep our existing road network in acceptable repair.
For comparison, all highway capital expenditures across all government units totaled $105.4 billion in 2015, only a portion of which goes to repair. Policymakers treat roads as economic assets on their balance sheets, but they are also major financial liabilities. They bring guaranteed costs over their life cycles—costs that are rarely fully accounted for on the front end. The true cost of our roads is likely even higher than the figures above, which do not account for bridge repair needs and other costs associated with maintaining our road
network, such as snow removal, stormwater management, and traffic enforcement.
I have long maintained that the failure to properly maintain the road network represents a form of hidden deficit spending. Here are the numbers for Virginia:
Virginia state spending (2009 to 2014)
Annual average capital spending: $1.297 billion
Roadway expansion percentage: 31%
Roadway repair percentage: 19%
Other capital expenditures: 50%
Note: “Other” capital spending encompasses bridges, safety, engineering, traffic operations, and environmental enhancements.
State road conditions (2017)
Public center-lane miles: 12,752
% poor condition: 10% (13 best in the country)
% fair condition: 44%
% good condition: 45% (18th best in the country)
Change in pavement conditions by state
(roads reported in poor condition)
2009 — 3%
2017 — 10%
Lane-miles added (2009 to 2017)
(State-managed roads)
2011 lane-miles: 126.124
2017 lane-miles: 128, 189
Lane-miles added: 2,065
(All jurisdictions)
2009 lane-miles: 160,727
2017 lane-miles: 163,648
Lane-miles added: 2,271
Virginia accounted for only 1% or so of the total increase in lane-miles nationally, significantly less than its share of the population. However, using the report’s rule-of-thumb of $24,000 repair cost per lane-mile, Virginia added $54.5 million in annual maintenance liabilities between 2009 and 2017.

