
by Steve Haner
So, let me get this straight. If we willingly keep paying the carbon tax on our electric bills, then thousands of parcels of prime Virginia waterfront won’t slip beneath the waves? Was that the point of these parallel prophecies of doom in the September 12 Richmond Times-Dispatch and Virginia Mercury?
Another day, another dire climate catastrophe story meant to scare readers into dumping fossil fuels. This claim was that sea level rise by 2050 will raise the low tide lines along Virginia’s thousands of miles of tidal waterways, including the creeks and rivers, and cover tens of thousands more acres. The RTD translated that into 160 square miles inundated.
Is there relative sea level rise underway? Yes. There has been since before Jamestown was settled, actually since the end of the Ice Age. Is it rising as fast as they claim? No. But exaggeration makes for more scary copy.
In fairness, it was only Sean Sublette with the Times-Dispatch who went on to link this coming financial calamity (Virginia only taxes land to the low tide line, you see) to the fight over the Regional Greenhouse Gas Initiative (RGGI) and its resulting tax revenue. But the digital-only Virginia Mercury is also working overtime to prevent Governor Glenn Youngkin (R) from removing the state from that taxing compact. More on RGGI later. This column is to dispel the nonsense about the sea swallowing Virginia so rapidly.
The study, from a non-profit dedicated to inventing and packaging climate alarmism for the mass media, is of course based on models of future sea level rise that assume varying rates of acceleration. The models predict the relative sea level will rise faster than the actual record to date would indicate, so the hard data is ignored.
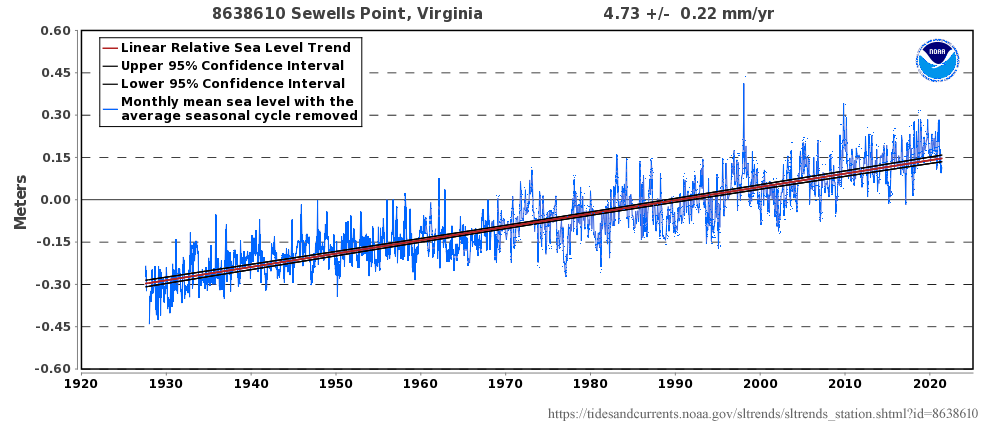
The actual record to date is readily available from the National Oceanic and Atmospheric Administration (NOAA), and the nationwide list of tide gauges is here.
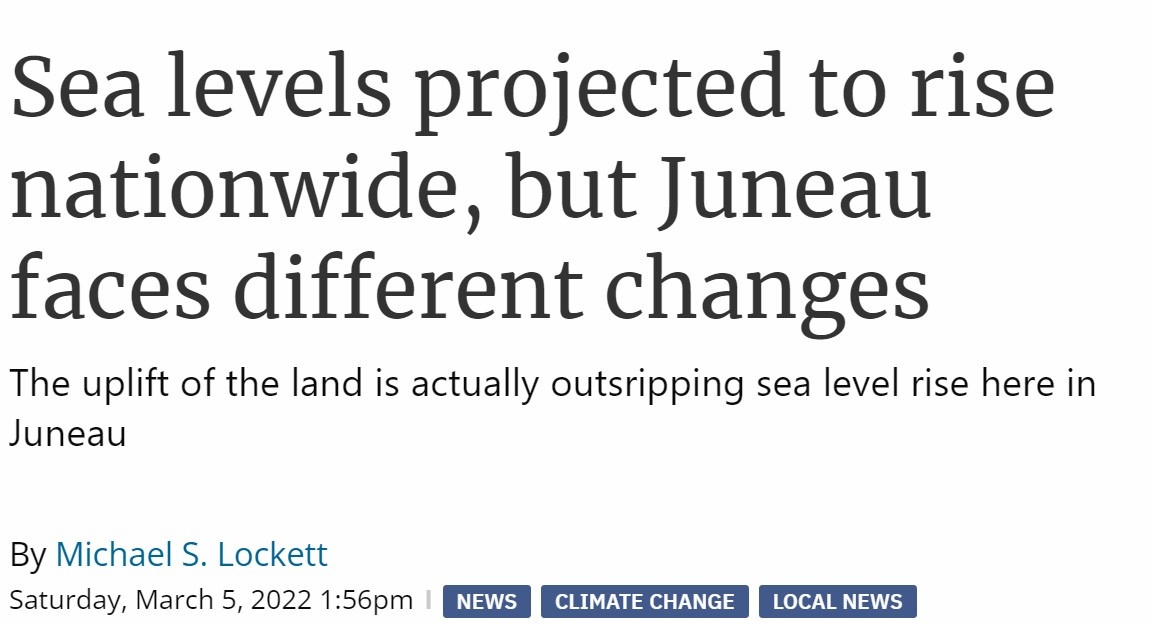
It is quite useful, showing when the gauge was installed, what the average annual change since then has been in millimeters, and then converting that into changing levels per century. One can’t say “rising” levels because in parts of the country (see Alaska) the relative sea level is dropping. How can that be?
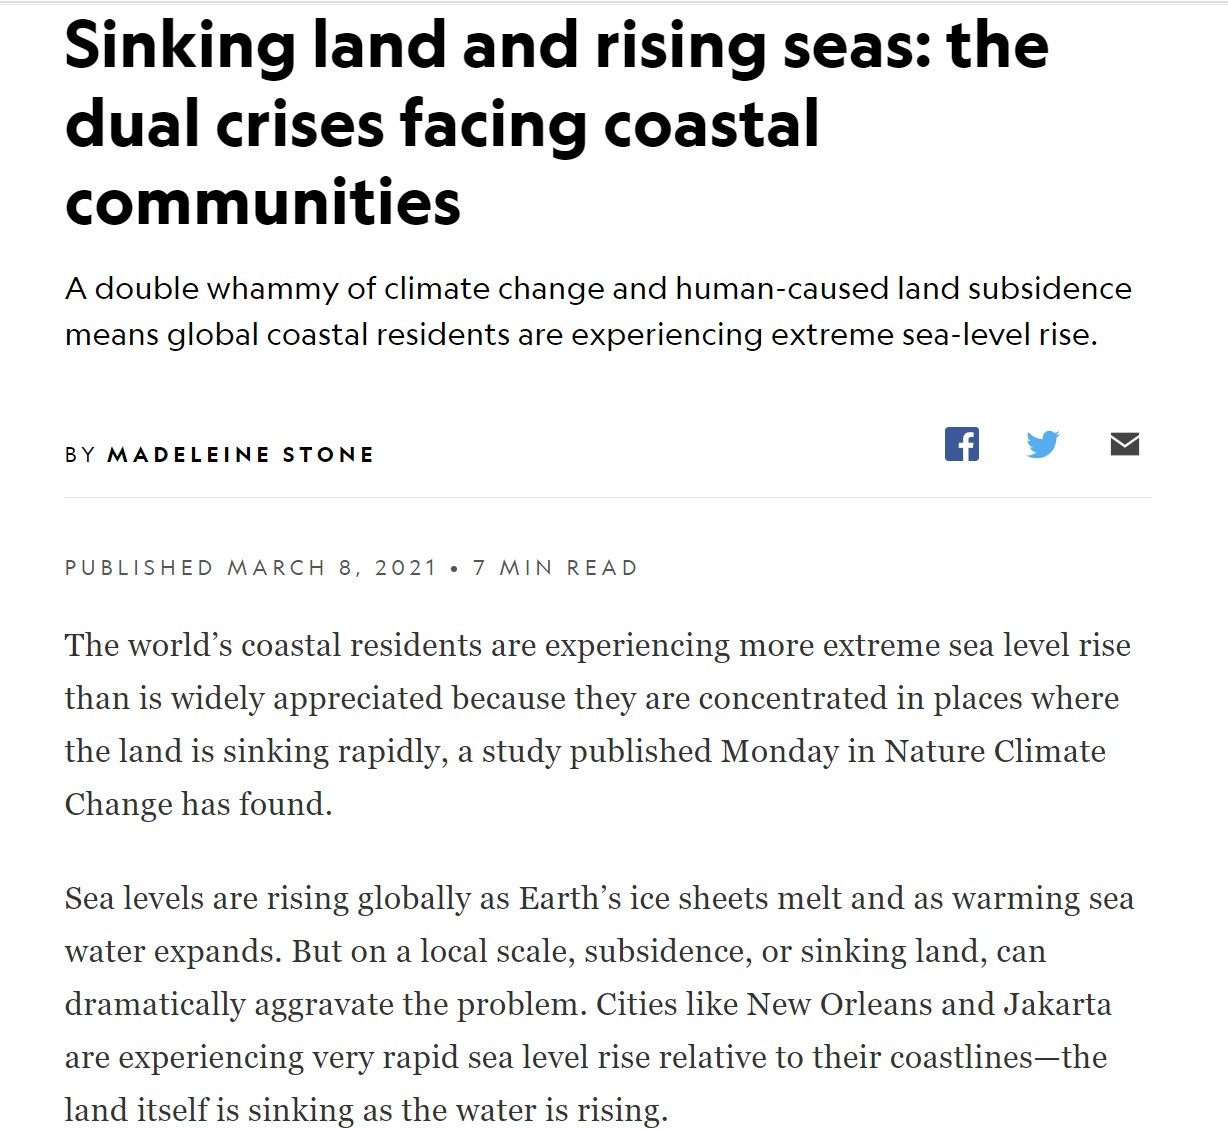
Well, Virginia has some fairly high rates of rising relative sea level due to subsidence. Parts of our coastline are known to be sinking, a fact well known (but completely omitted) by those who wrote the two reports this week and the purported study. But the massive geological forces causing the Chesapeake Bay region to sink are causing the land to rise on the other side of this same tectonic plate in Alaska.
Even within the set of Virginia gauges there is significant variation. The Chesapeake Bay Bridge Tunnel sensor is showing the most, 1.94 feet of relative (to the sinking land) sea level rise per century. Kiptopeke’s sensor comes in at 1.26 feet per century. Sewell’s Point in Norfolk has the longest set (95 years) of readings and is coming it at 1.5 feet per century.
Yet using the models the authors of the study based their dire projections on almost 1.5 feet more of relative sea level rise from 2000 to 2050, a half century. No East Coast sensor is showing that rate. And given the variations you can already see between all those sensors, is it logical to suddenly assume straight line and uniform increases going forward? No, it is ridiculous.
If you walk those waterlines, are they all nice one-to-one beach slopes? Are there not often steep embankments, so any rise in the tide just climbs the side of the bank and doesn’t inundate one blade of grass? Aren’t there actual walls on some of the banks? The assumptions pile on the assumptions, which should have bred some skepticism. A few caveats are buried in the report text. Yet the projections of massive inundated areas, plus claimed actual lost tax revenues, are blandly presented as fact in both publications. (“Hey, we just quoted the report! Don’t blame us if it’s mostly bull!”)
The real point of this exercise is easy to spot in the Climate Central report: “Ultimately, reducing and eventually eliminating carbon pollution will prevent the problems identified in this report from getting much worse.” Buy an electric car, dump your furnace for a heat pump, replace reliable electric plants with intermittent wind turbines, and Middlesex County won’t slip beneath the waves.
Then the Richmond newspaper further milked it as justification for continuing to impose the RGGI carbon tax on Virginia’s electricity producers, who then pass it along to their customers. The companies pass all their costs along to their customers, especially any taxes and fuel costs. Virginia has now collected $452 million in RGGI taxes in less than two years.
Half of that tax money is dedicated to flood mitigation and prevention programs, and the Richmond newspaper noted some of them being funded so far in two counties it mentioned as vulnerable to losing huge amounts of land. The projects involve building vegetative buffers intended to mitigate future flooding, but none of them can or will deal with this problem of creeping low tide lines (even if creeping much more slowly than claimed).
Humankind cannot hold back the rising tide. But since we can actually measure it, don’t lose any sleep over projections that double or triple the rate of change we do observe. If you are looking for actual measurements of sea level rise, start with the islands on that NOAA table. (Honolulu, a half-foot per century, Midway Atoll, a half-foot per century, San Juan, Puerto Rico, seven-tenths of a foot per century.) You never see those mentioned.
Leave a Reply
You must be logged in to post a comment.