
This communication from reader John Butcher was worth reproducing in full. I publish it here with his permission. — JAB
I enjoyed Peter’s piece about “The Richmond Elite’s Bizarre Self Image” and the comments that followed. I want to suggest that the focus there on Richmond poverty is appropriate but misses the main point.
Beyond question, the kids who are economically disadvantaged are educationally disadvantaged. Indeed, we can tease out the magnitude of the poverty effect from the SOL test data. Here, for instance, is a plot of the 2013 division reading pass rate v. the percentage of students who are economically disadvantaged under the Education Department’s definition:
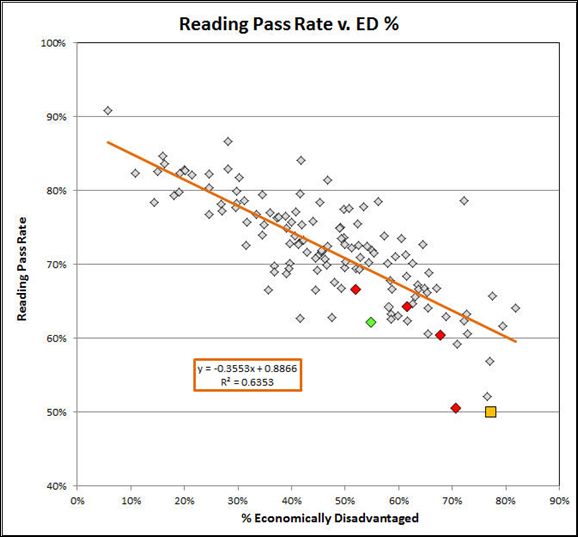
The data give a decent least-squares fit (R2 = 0.64), suggesting that the ED percentage indeed correlates with the scores. On this graph, Richmond is the gold square. (Recall that Richmond had the lowest reading score in the Commonwealth this year). The red diamonds are (from the left): Hampton, Newport News, Norfolk, and Petersburg. Charles City is the green diamond.
Here is the same graph for the math tests:
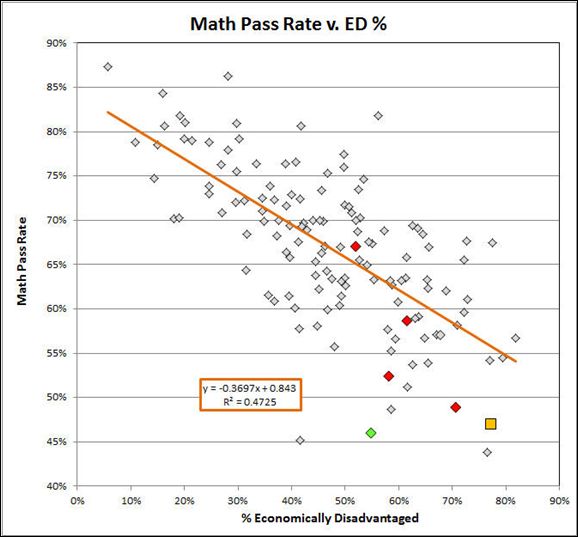
The color codes are the same and the correlation is not quite as good.
Richmond is 2.52 standard deviations below the fitted line on the reading test, 1.36 below on the math test.
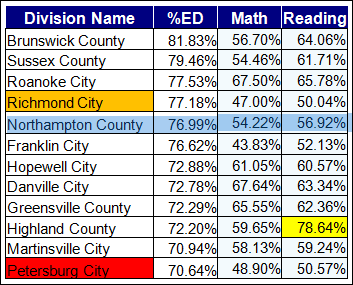
Focusing more narrowly on the divisions with more than 70% economically disadvantaged students, we see:
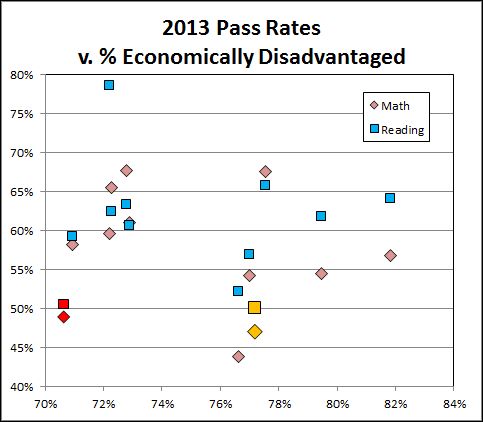
On the graph, the gold points are Richmond; Petersburg appears in red.
In this group of twelve divisions with challenging student populations, Richmond was outperformed — for the most part, considerably outperformed — by all the other divisions on both subjects, with the single exception of Franklin City on the math tests.
In short: Socioeconomics does not provide an excuse, much less a reason, for Richmond’s lousy performance.
Delving further: The VDOE database also gives data for students who are or are not economically disadvantaged. Plotting the pass rates of the economically disadvantaged students and the rates for the students who are not vs. the percentage of students who are economically disadvantaged, by division, gives the following for the reading tests:
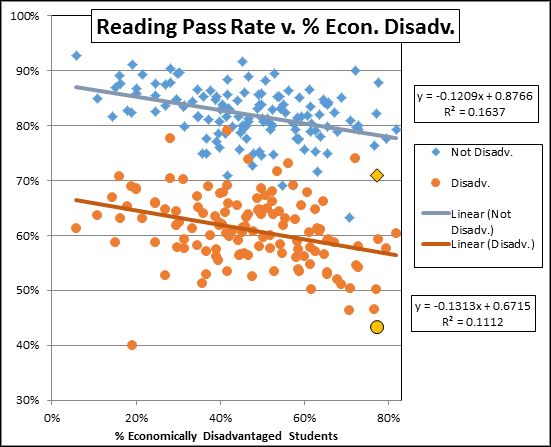
The data support the intuitive notion that a high percentage of poor students leads to lower scores for both the poor and non-poor students. The data also show that Richmond (the large, gold diamond and circle) grossly underperforms the trend.
The math data show very much the same patterns:
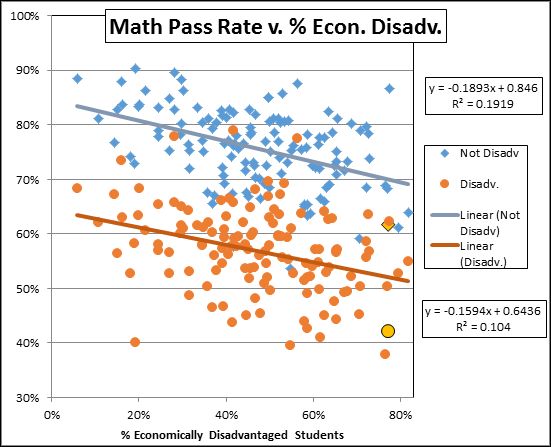
The clear conclusion here is that Richmond’s public schools are grossly underperforming for all our students.
Said otherwise, Richmond is doing an awful job and the high concentration of poverty here does not provide an excuse.
I follow your blog in my RSS reader and enjoy your and Peter’s writing. Keep up the Good Work!

