
 by James A. Bacon
We have documented in previous posts that there is only a weak correlation between the amount of money a Virginia school district spends per pupil and educational achievement as measured by the pass rates on Standards of Learning tests. But there are other ways to make the same point.
Our Lynchburg correspondent Jim Weigand has brought to my attention the publication of a report based on 2015 data comparing the Required Local Effort (RLE) for Virginia’s localities and what the school districts actually spend on K-12 education.
For those of you not conversant with educratese, RLE represents the minimum expenditure required to meet the state’s “Standards of Quality,” an assessment of inputs such as the ratio of teachers and staff to the number of students. By comparing RLE to actual local expenditures, the VDOE report calculates the amount of a jurisdiction’s own tax dollars (as opposed to state and federal dollars) that it spends above and beyond the minimum requirement.
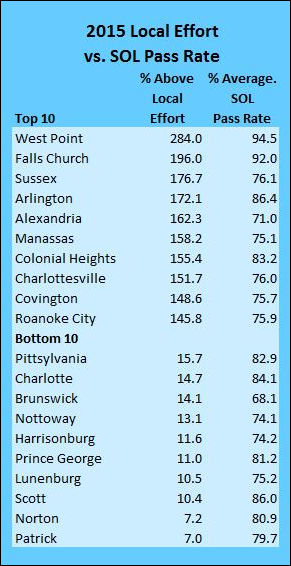
As the chart above shows, school districts vary widely in how much fiscal effort they devote to funding their schools — from 7% above the rock-bottom minimum in Patrick County to 284% of the minimum for the town of West Point. And what is the payoff for that extra spending? We compared the RLE percentage with average SOL scores for the 2014-2015 school year for each school district.
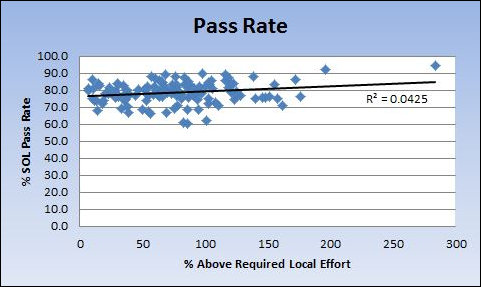
As can be seen in the scatter graph above, there is almost no correlation at all. The R² measure of correlation is less than 5%.
Does that mean the extra money is wasted? Not necessarily. Some school districts may be spending more money because they have a higher percentage of students who are handicapped, economically disadvantaged or speak English as a second language. But the graph is a pretty good sign that dumping more money into schools to meet or exceed the Standards of Quality is not an effective strategy.
Instead of blindly plowing more money into Standards of Quality, perhaps money should be steered to schools with more at-risk students. Or perhaps we could study what the successful schools are doing differently from the less successful schools and try to replicate the secret sauce. Or perhaps we could do almost anything but what we’re doing now.
To see the numbers for all localities in Virginia, click here.
Update: Over at Cranky’s Blog, John Butcher makes some adjustments to the data that I should have made, breaks down performance by SOL subject matter, and offers his own unsurpassed commentary.

