
by James A. Bacon
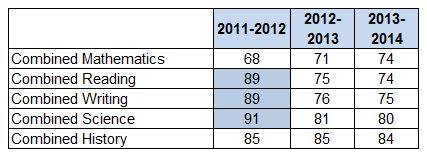
The 2014 Standards of Learning (SOL) scores are in, and it appears that Virginia’s school divisions made decent improvements in mathematics over the past year while losing ground marginally in reading, writing, science and history. Bottom line: Virginia students tread water another year.
Here are the percentage pass rates across all grades and schools systems. (The cells highlighted in blue reflect old tests, which were changed in 2012-13 to make them more rigorous.)
Another year running in place — that’s demoralizing. Can we find some seeds of succor? There are a few. I plowed through the data released by the Virginia Department of Education and compiled composite pass scores for every school district. The highest possible score — a 100% pass rate for all five subjects — is 500. I pulled out the school districts with an average pass rate of 80%, hardly a world-beating performance but at least sufficient to prosper in a knowledge-based economy.
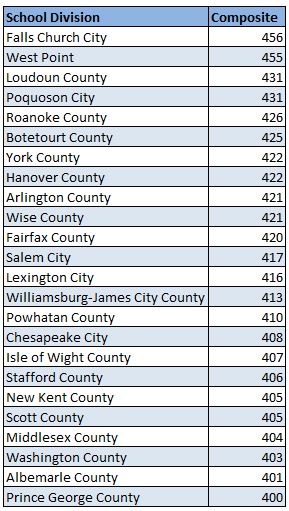
As one would expect, affluent Northern Virginia cities and counties, which have some of the highest median incomes and highest average levels of education in the country, stood out in this list of the top-24 performing school districts.
But there are some pleasant surprises, most notably West Point, a small mill town on the York River and one of only two towns in Virginia that maintains its own school district. The median household income in 2010 fell short of $50,000 — less than half that of Loudoun County, Virginia’s most prosperous locality. (Although incomes are not high, poverty is very low in the town — less than 3.0%.)
How do the school children of a small, southern mill town out-perform super-affluent localities such as Loudoun, Arlington and Fairfax Counties? It could be a fluke — the town’s population is only 3,300. Maybe the outstanding performance was the result of random variation, which create wider swings in smaller numbers. Or maybe West Point schools are doing something right that others could emulate. Some enterprising newspaper reporter should find out.
Other stand-outs are schools in the Roanoke Valley. Roanoke County, Salem and Botetourt County schools all scored in the top twelve. Those school districts are significantly larger than West Point’s, so it’s harder to attribute such consistently high scores to random fluctuations.
Even more surprising is the performance of school divisions in far Southwest Virginia. Wise County, which racked up scores equal to Fairfax County, sits in the heart of Virginia’s economically ravaged coalfields. This is deepest, darkest Appalachia. Scott County and Washington County, also in Southwest Virginia, performed in line with affluent exurban school districts in the Richmond and Hampton Roads regions.
Again, one must ask the question: How do these school systems beat the odds? They have fewer resources. Students’ parents have lower incomes and less education than in more affluent districts. The bromides about what determines school performance — spending per student, socio-economic status and education levels of the students’ parents — provide an incomplete explanation at best. What is that X factor? Can we capture it, bottle it and share it with other school districts?
I would love to crowd-source the analysis of these questions. For anyone who is interested in digging into the numbers, here they are:
- State (Excel)
- Division-Level (Excel)
- School-Level (Excel)

