
 by James A. Bacon
Jim Weigand, also known on this blog as Hill City Jim, responded to my call yesterday for a crowd-sourcing of the Standards of Learning data to better understand the key drivers of educational performance. Why do some school systems show SOL pass rates that are so much higher than others? Clearly, the level of affluence and education in a school division plays a major role. But does that tell the whole story? Do some racial or regional groups put a higher or lesser premium on educational achievement than others? Do some school divisions simply do a better job?
One of the starkest demographic divisions in SOL performance is race. As Weigand crunched the numbers, white students statewide had an 84% pass rate on their SOLs while black students had a 63% pass rate — a racial gap of 21 percentage points. (Weigand did not run numbers for Asians, Hispanics or other ethnic/racial minorities.) Tragically, the low pass rate is an advance indicator that yet another generation of blacks will be relegated to the bottom of the educational and income hierarchy in the United States.
The big question is why. Does the SOL performance gap reflect inequalities in the distribution of resources in Virginia school systems? Does it reflect different cultural attitudes among blacks — an aversion to “acting white”? Or are other factors responsible — subtler forms of institutional racism, perhaps, or the distribution of races between wealthy and poor regions of the state? Liberals and conservatives will be tempted to revert to their default ideological positions (liberals skew to resources/racism explanations, conservatives tend to blame black cultural attitudes) but this is too important to leave to ideology. We need reality-based answers so we can address real problems, not philosophical figments.
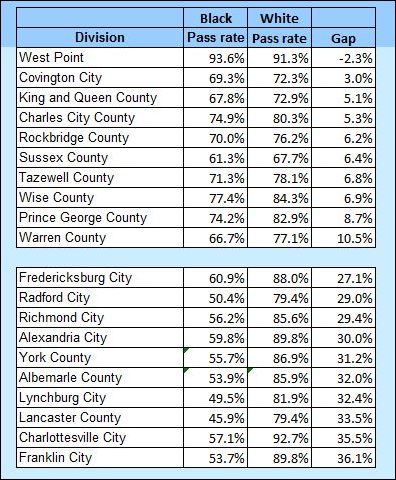
I have refined Weigand’s numbers with an eye to identifying outliers: the 10 school divisions with the smallest racial performance gaps and the 10 divisions with the largest gaps. Interestingly enough, the tiny West Point school system is an extreme outlier. In yesterday’s analysis, the mill town showed the second highest SOL composite pass rate of any system in the state. In today’s data, it is the one school system in Virginia where black students marginally out-performed white students! Once again, I challenge an enterprising newspaper reporter to take a close look at the West Point school system to see what’s going on there.
Other observations from the outliers:
- School divisions with small gaps in racial performance are smaller school systems. Are these divisions more thoroughly integrated by virtue of having fewer schools? If you’ve got only one high school in the jurisdiction, it has to be integrated. Or are there other ways in which smaller school systems could lead to more egalitarian results?
- The smallest-gap school divisions also tend to come from poor regions of the state. If everyone is poor together, perhaps there are fewer racial disparities in household income and education.
- The biggest-gap school divisions skew more urban. And what’s going on in Charlottesville and Albemarle County, both of which appear on the list of school divisions with the biggest racial gaps? That is not what we’d expect from school systems that serve children of University of Virginia faculty and administrators.
Looking at outliers is a useful exercise but it will take us only so far. We need to look at the distribution of SOL performance across all school systems, including those closer to the mean. It’s also worth exploring other performance gaps — how about the gap between Asians and everyone else, including whites? How about the gender gap? To what degree do girls out-perform boys statewide? And what about the gender gap within racial groups? Is that gap greater in some ethnic or regional cultures (inner-city black, white Appalachian) than others?
If you want to take this analysis to the next level, you can access Weigand’s numbers here. Or, please, bring fresh data to the discussion.

