
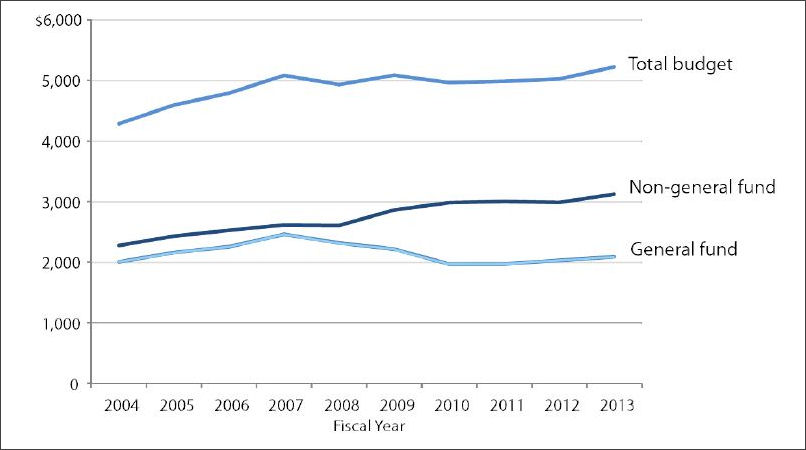
Per capita state spending adjusted for inflation, FY 2004-2013. Graphic credit: JLARC.
Every year the Joint Legislative Audit and Review Commission publishes an overview of Virginia state spending. Perhaps the most important numbers are shown in the chart above — spending adjusted for 10% population growth and 23% inflation. By that measure, General Funding spending held steady over the past decade while Non-General Fund (NGF) budget grew unabated. The growth in NGF budget was spurred by growth in the Department of Accounts, reflecting transfers payments to localities from the communications sales tax; increased participation in the Virginia College Savings Plan; and higher education tuition payments.
Here’s a breakdown of growth (not adjusted for inflation or population growth) by secretarial department:
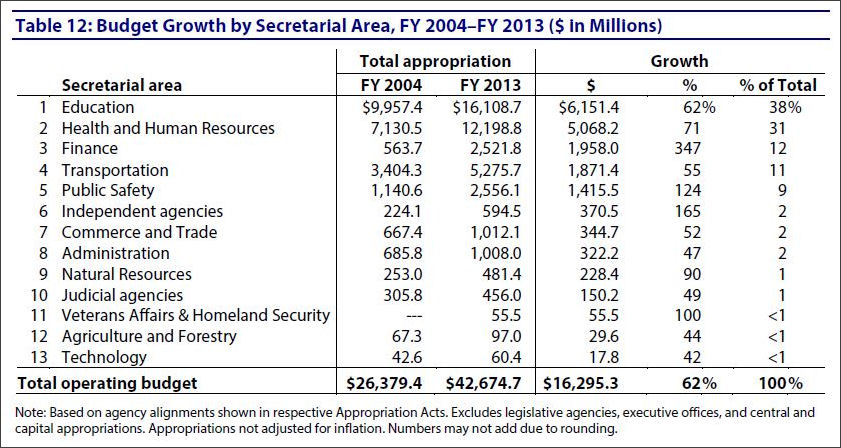
Click for larger, more legible image.

