
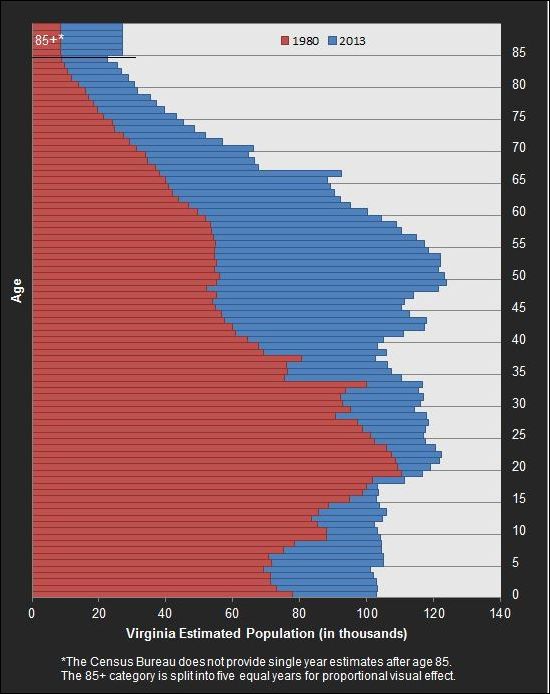
This graph comparing Virginia’s age between 1980 and 2013 comes from Luke Juday’s latest post over on the Stat Chat blog, published by the demographics shop the Weldon Cooper Center for Public Service. I urge you to check out the opening chart in his post to see an animation of the changes year by year. It’s fascinating to watch the bulging Baby Boomer generation crawling up the age ladder.
I would love to see a projection of Virginia’s demographic profile over the next 20 years. We would see the big Boomer blob move up, out of the workforce and into retirement age. The implications of that massive shift cannot be over-estimated. Virginia’s working-age population won’t be increasing in size — indeed, it probably will begin shrinking within a decade. Extrapolate that trend nationally, and you’ll understand why the Congressional Budget Office (CBO) maintains that the structural U.S. budget deficit — “only” $583 billion this year, according to the Obama administration’s updated forecast, will march relentlessly higher within a few years as the growing ranks of seniors put increasing stress on the Medicare, Medicaid and Social Security programs.
America still faces a Boomergeddon scenario, although we may have bought ourselves a few years’ grace. The CBO thinks that the slowdown in the growth rate of medical spending experienced since the 2007-2008 recession is a lasting phenomenon and will slightly bend the spending curve downward — enough to keep the Medicare Part A trust fund solvent through 2030. In February, the non-partisan budget shop had projected that the trust fund would run out of money in 2025, reports the Wall Street Journal.
The good news is that Congress has five more years to dither and procrastinate about reforming Medicare. The bad news is that Congress probably will take full advantage of that five years before making hard choices.
— JAB

