
by James A. Bacon
One of the most important insights of the Smart Growth movement is that the household costs of housing and transportation are intertwined. You can buy a less expensive house if you are willing to live far from the urban core with its more desirable location and higher property values. But you lose a lot in additional transportation costs and commuting time.
In 2008 the Center for Neighborhood Technology (CNT) developed a Housing + Transportation Index show how the true cost of a housing location varies considerably if you incorporate transportation costs into the calculation. Now CNT has partnered with the Department of Housing and Urban Development to update its methodology and generate more data.
Among the more interesting data points is the “Transportation Costs for the National Typical Household” for metro regions with populations of one million or greater. Here are the numbers for Virginia’s Big Three Metropolitan Statistical Areas:
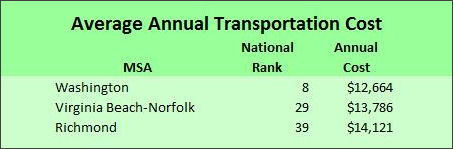
Comparing regions, it is interesting to note that the Washington region, known for its unaffordable housing, offsets those prices to some degree with lower transportation costs. Not that it makes much difference. NoVa remains unaffordable. What the new index does is show that other Virginia regions are unaffordable as well.
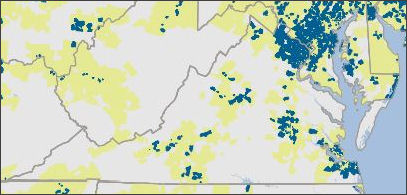
Here’s the “housing affordability” map for Virginia. Yellow areas show where the regional typical household makes enough money to dedicate less than 30% of its income to housing. Blue areas show where they pay a higher percentage.
The map below looks at housing and transportation together. Yellow marks areas where the typical household pays less than 45% for housing and transportation combined, blue where they pay more.
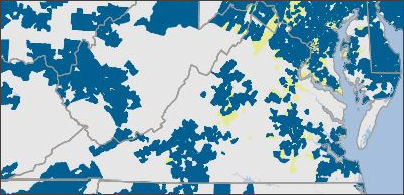
Yikes! Affordability has almost disappeared!
Drill deeper into the data with this tool and you can see that that the picture looks more variegated on a metropolitan level. The situation is bad but not as grim as the map makes it appear.
While the index is useful for households making decisions where to live, it is less than authoritative. For instance, it leaves out the time cost of travel, which can be every bit as important as the out-of-pocket cost of driving or taking the bus. Also, it omits the cost of public subsidies. Roads, highways, rail and buses all depend upon taxpayer-funded subsidies (over and above fares, tolls and user fees) for capital and/or operating costs. But if nothing else, the index highlights the regional variability of housing and transportation affordability and provokes discussion on how to improve the mix.

