
by A. Fletcher Mangum

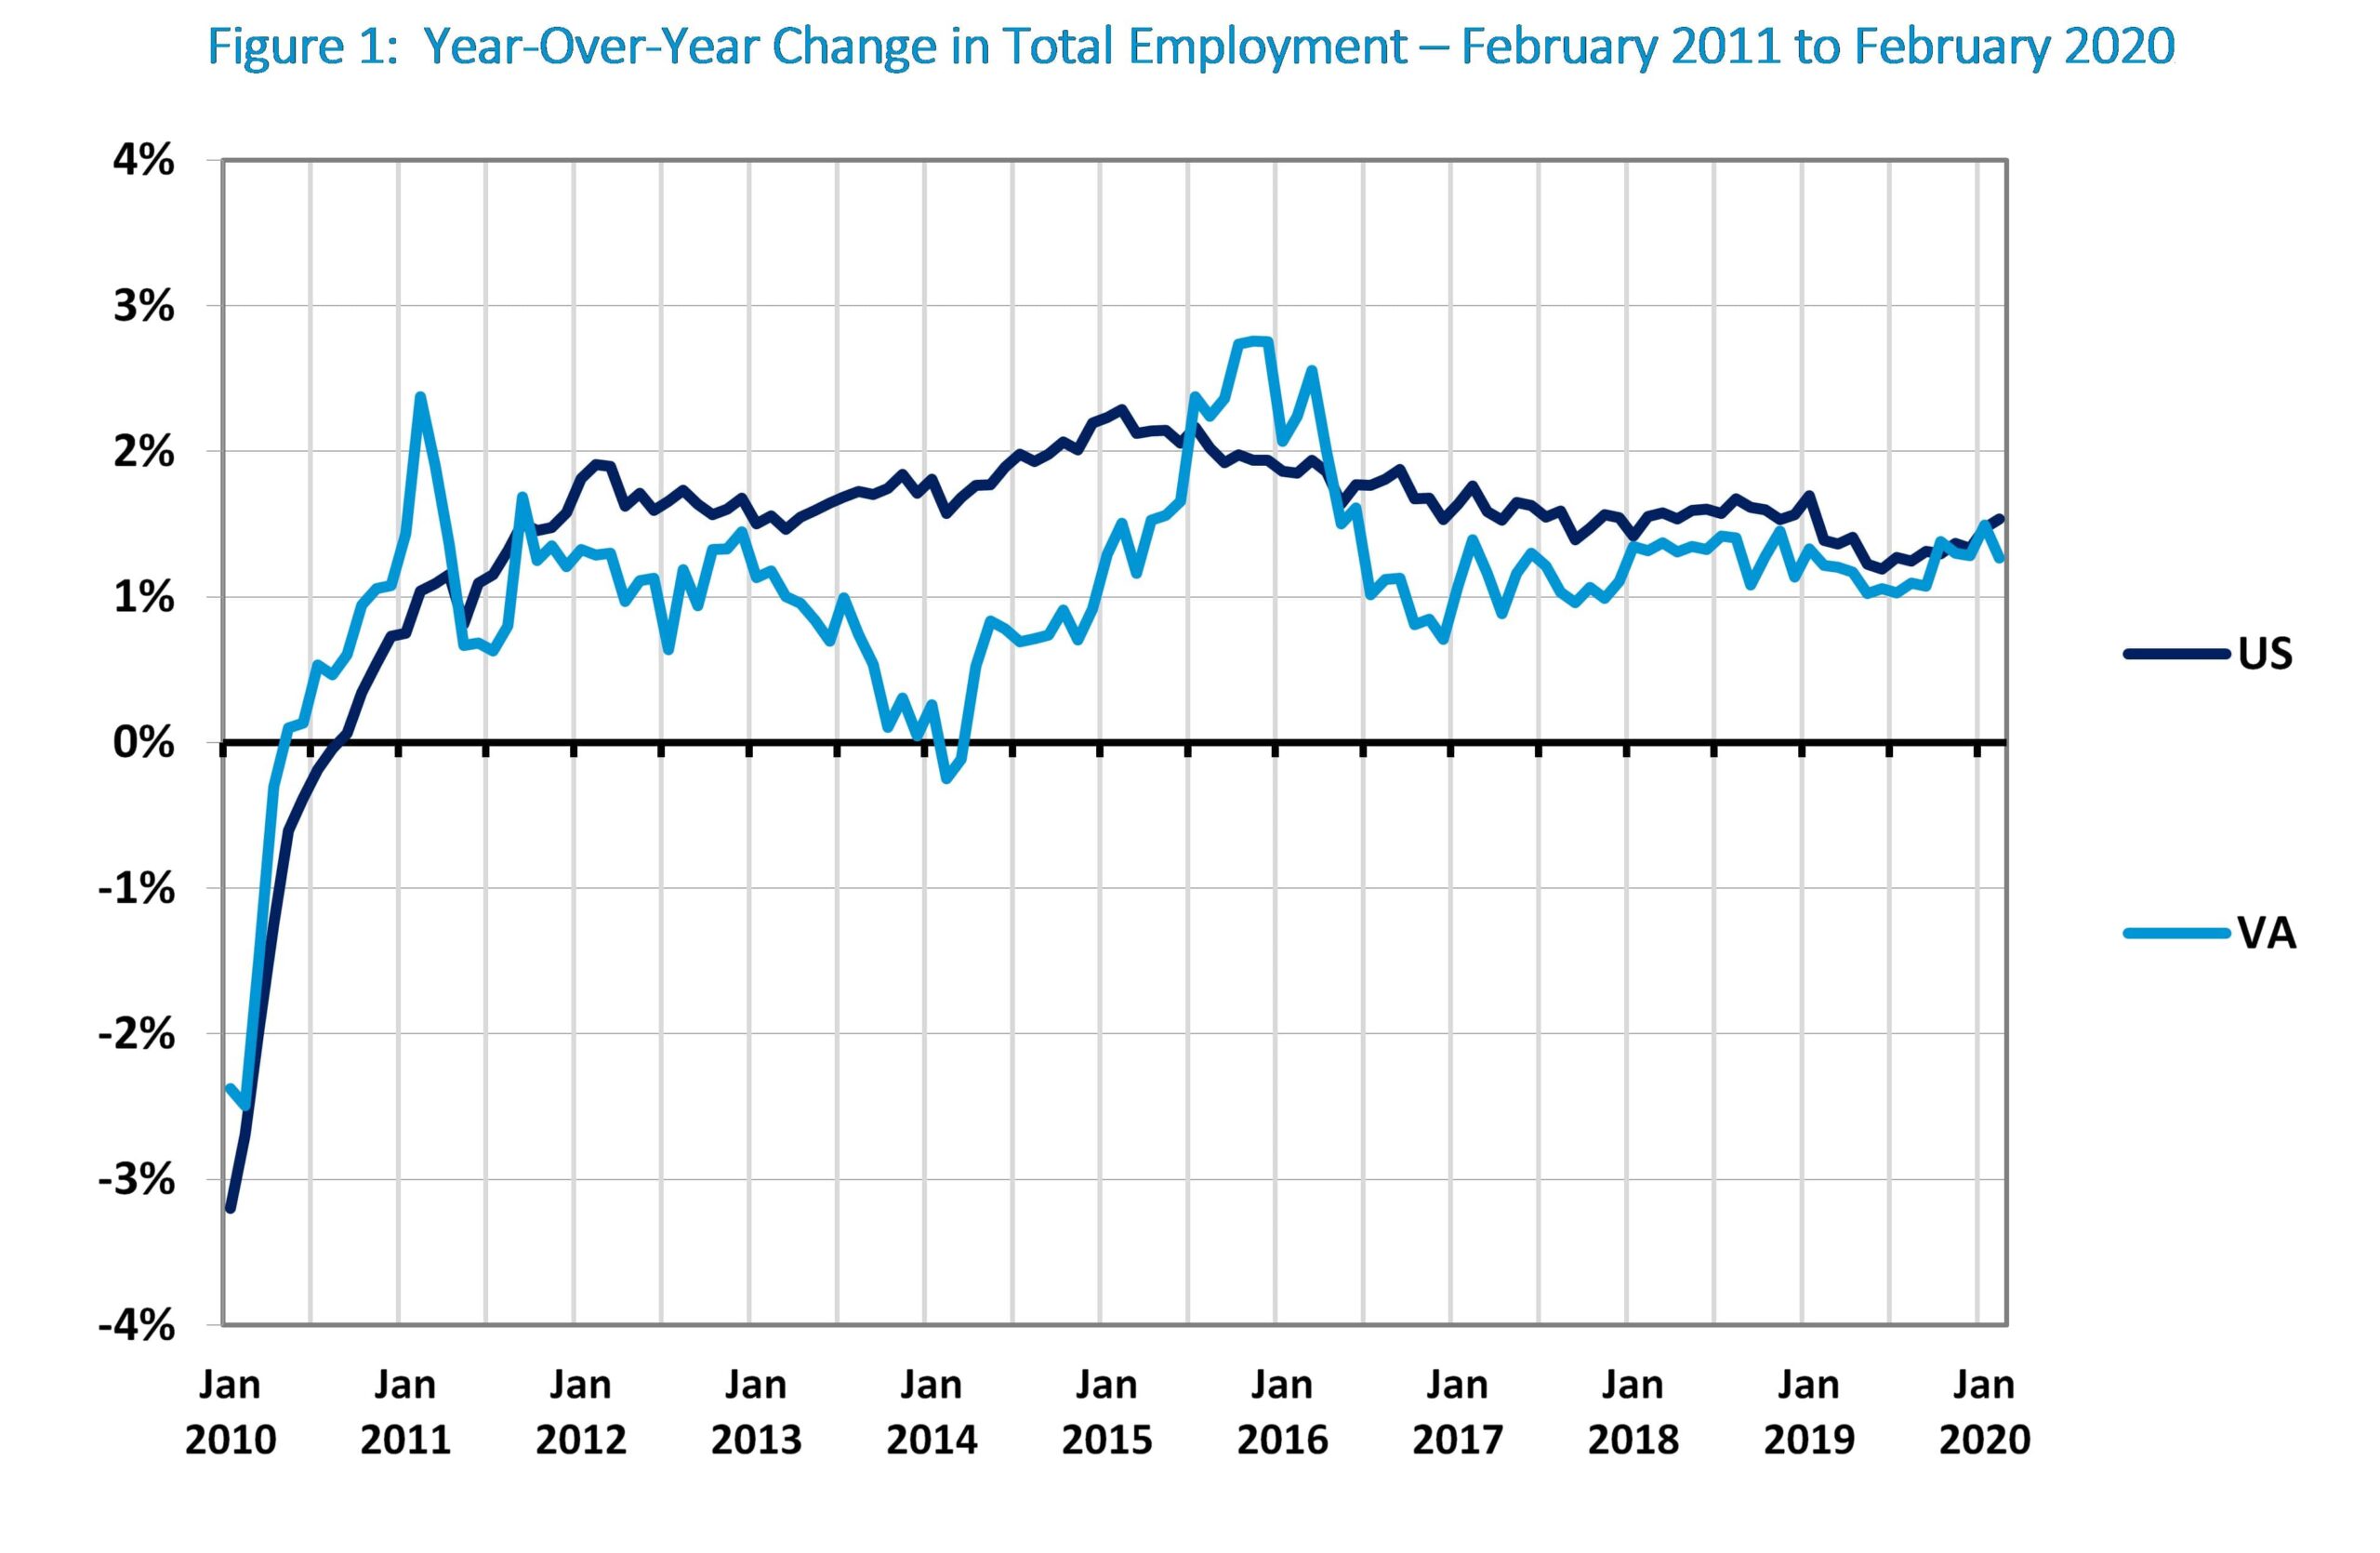
Virginia’s employment growth has been underperforming the national economy for quite some time. As shown in Figure 1, soon after the recovery from the Great Recession began in earnest in 2011 Virginia’s year-over-year growth in total employment uncharacteristically fell behind the national economy and even briefly went negative in 2014.
Then in early 2020, just as in the rest of the country, economic conditions in Virginia changed drastically when the governors’ lockdowns of economic activity were imposed in response to the pandemic. Between March and April of that year nearly 20 million jobs were lost nationally (or approximately one out of every eight jobs in the country), while in Virginia the employment loss was 428,000 jobs (or approximately one out of every nine jobs in the state). Virginia was not as badly hit as the nation as a whole because of its heavy dependence on federal employment and contracting (which were not significantly impacted by the lockdowns) and disproportionate employment in the Professional and Business Services sector (where people were better able to work remotely).
However, history is now repeating itself as Virginia once again falls behind the nation in the recovery and that trend is getting worse. In April of this year, when year-over-year employment growth turned the corner and moved into positive territory nationally, Virginia trailed the pack and continues to do so. In April Virginia ranked 41st among the states in year-over-year total employment growth, gained ground to hit 32nd in May and 30th in June , and then fell back to 39th in July and all the way to 47th in August.
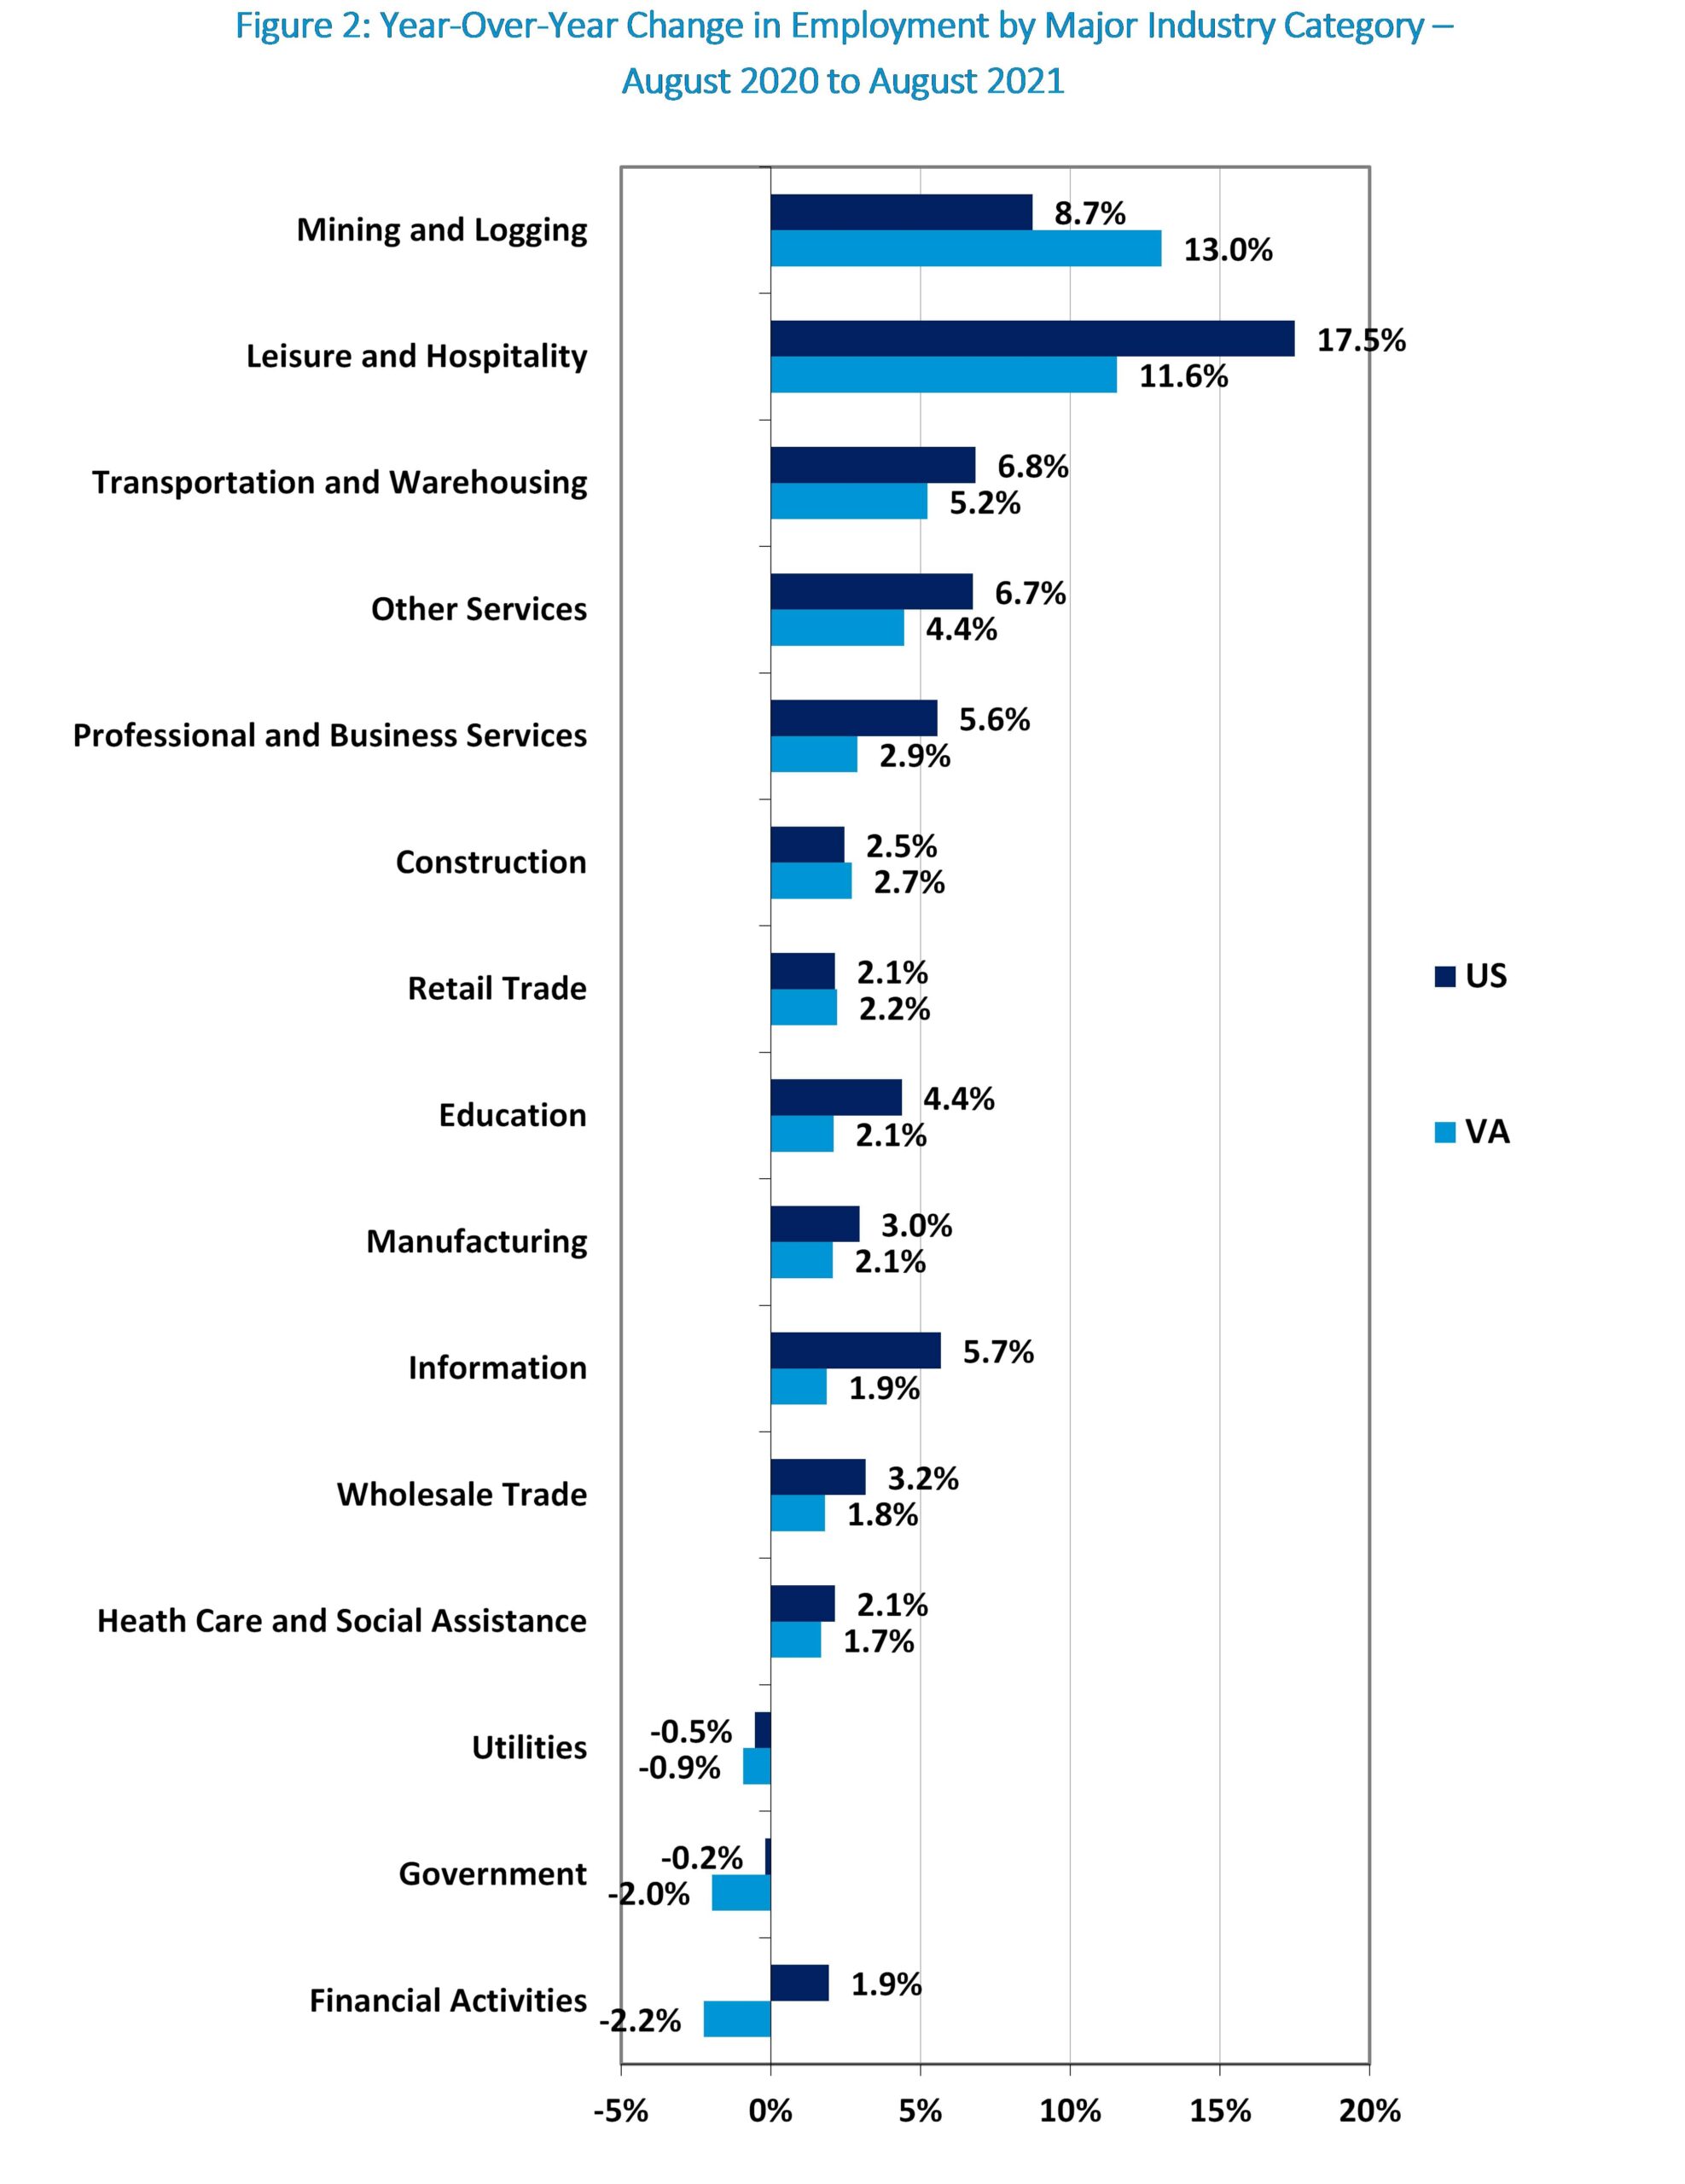
As shown in Figure 2, when we look at major industry categories, Virginia outperformed the national average in just three of the fifteen major industry categories in August (mining & logging, construction, and retail trade) and underperformed the national average in the remaining twelve (manufacturing, wholesale trade, retail trade, utilities, transportation & warehousing, information, financial activities, professional & business services, education, health care and social services, leisure & hospitality, other services, and government). Importantly, had Virginia performed at the national average in each of these industry sectors in August total statewide employment would have been 3,987,418 jobs, nearly 76,000 jobs higher than the 3,911,700 jobs we actually saw that month.
In related news, Virginia also experienced a spike in initial unemployment claims in August with 16,593 claims filed the week ending August 14 and that trend seems to have persisted into September where Virginia is reported to have had the second highest number of initial unemployment claims of any state the week ending September 18.
One attribute of the Virginia economy’s prolonged economic underperformance is that we are beginning to look much more like our neighbors to the north that are generally characterized by less favorable business climates and anemic employment growth, and much less like our neighbors to the south that are generally characterized by more favorable business climates and robust employment growth.

Figures 3 and 4 provide a graphic visualization of this trend. Figure 3 compares Virginia’s pre-pandemic year-over-year employment growth between February 2016 and February 2020 to Maryland’s, New Jersey’s, New York’s, and Pennsylvania’s. As these data show, Virginia’s economic performance over this period tracked closely with that of these eastern seaboard states immediately to our north.
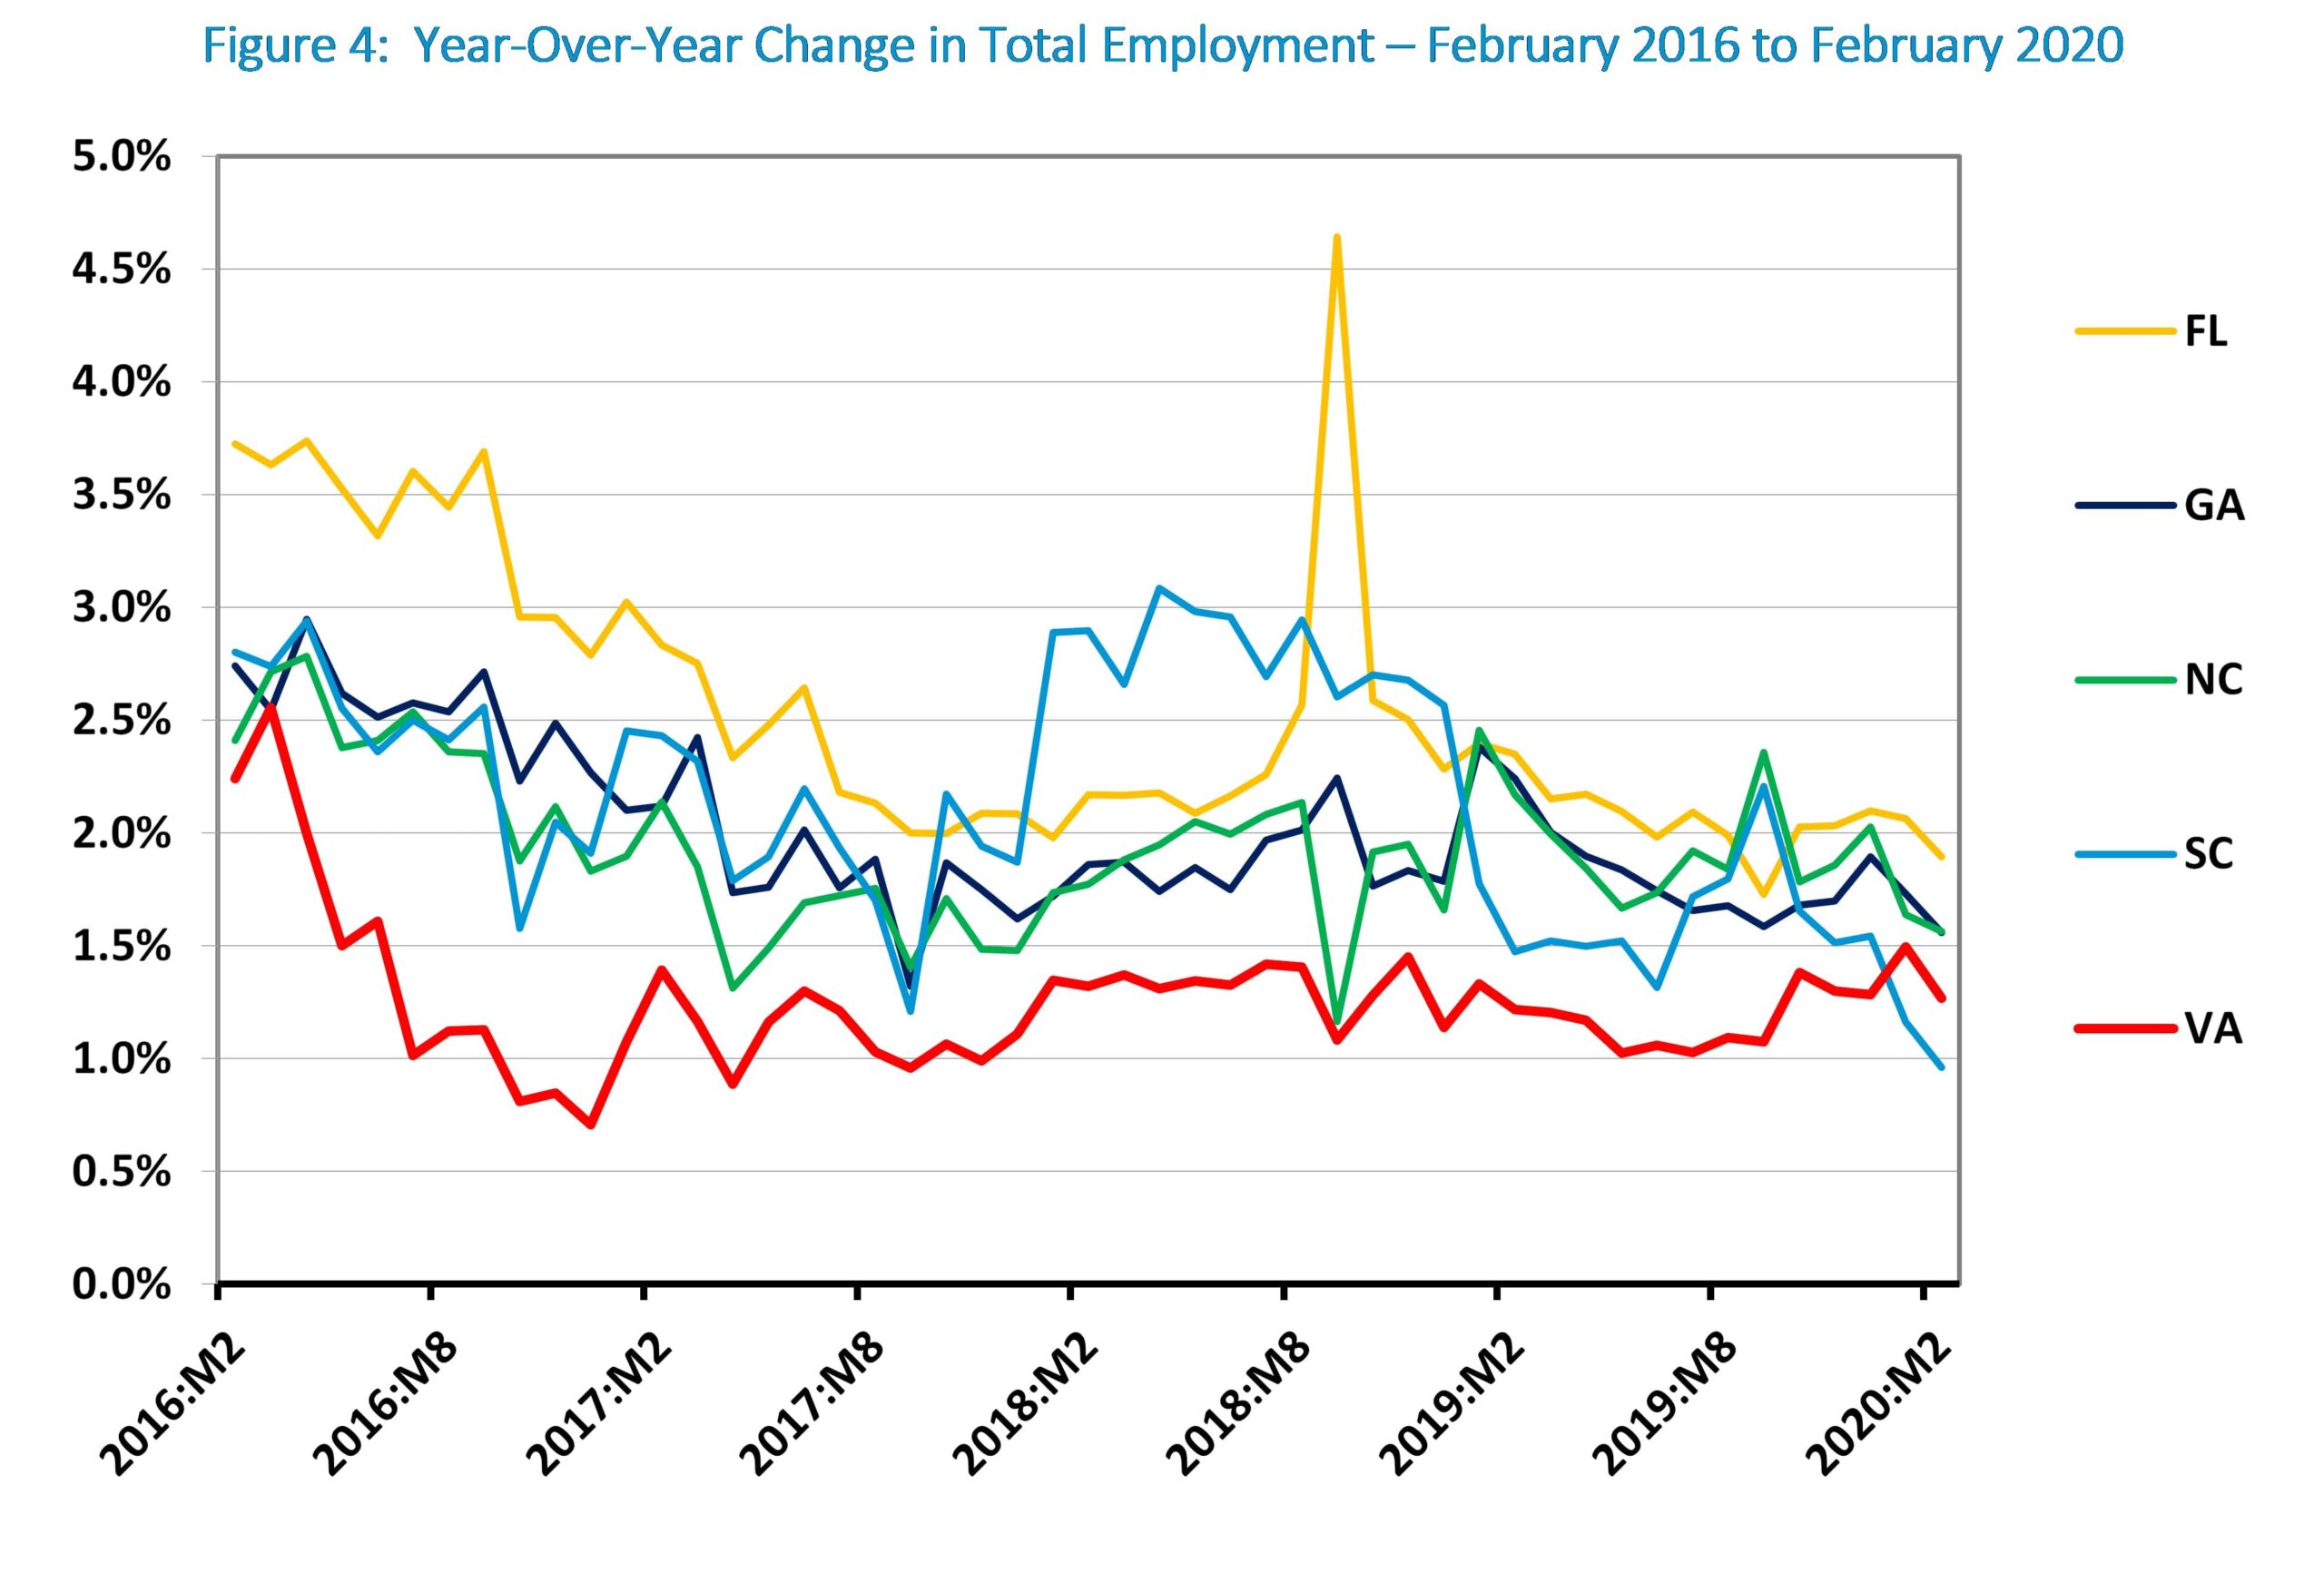
In contrast, Figure 4 compares Virginia’s year-over-year employment growth over the same period to Florida’s, Georgia’s, North Carolina’s, and South Carolina’s. As these data show, in this case Virginia’s economic performance was an outlier and significantly trailed that of these eastern seaboard states immediately to our south.
Finally, it is important to realize that a state’s relative economic performance has consequences that extend beyond its economy. As commonsense and numerous academic studies have shown, people vote with their feet as they migrate from one state to another in search of better economic opportunities. Based on available data, prior to 2013 Virginia had not experienced a net out-migration of population. However, since 2013 net out-migration has become a somewhat common occurrence for Virginia.
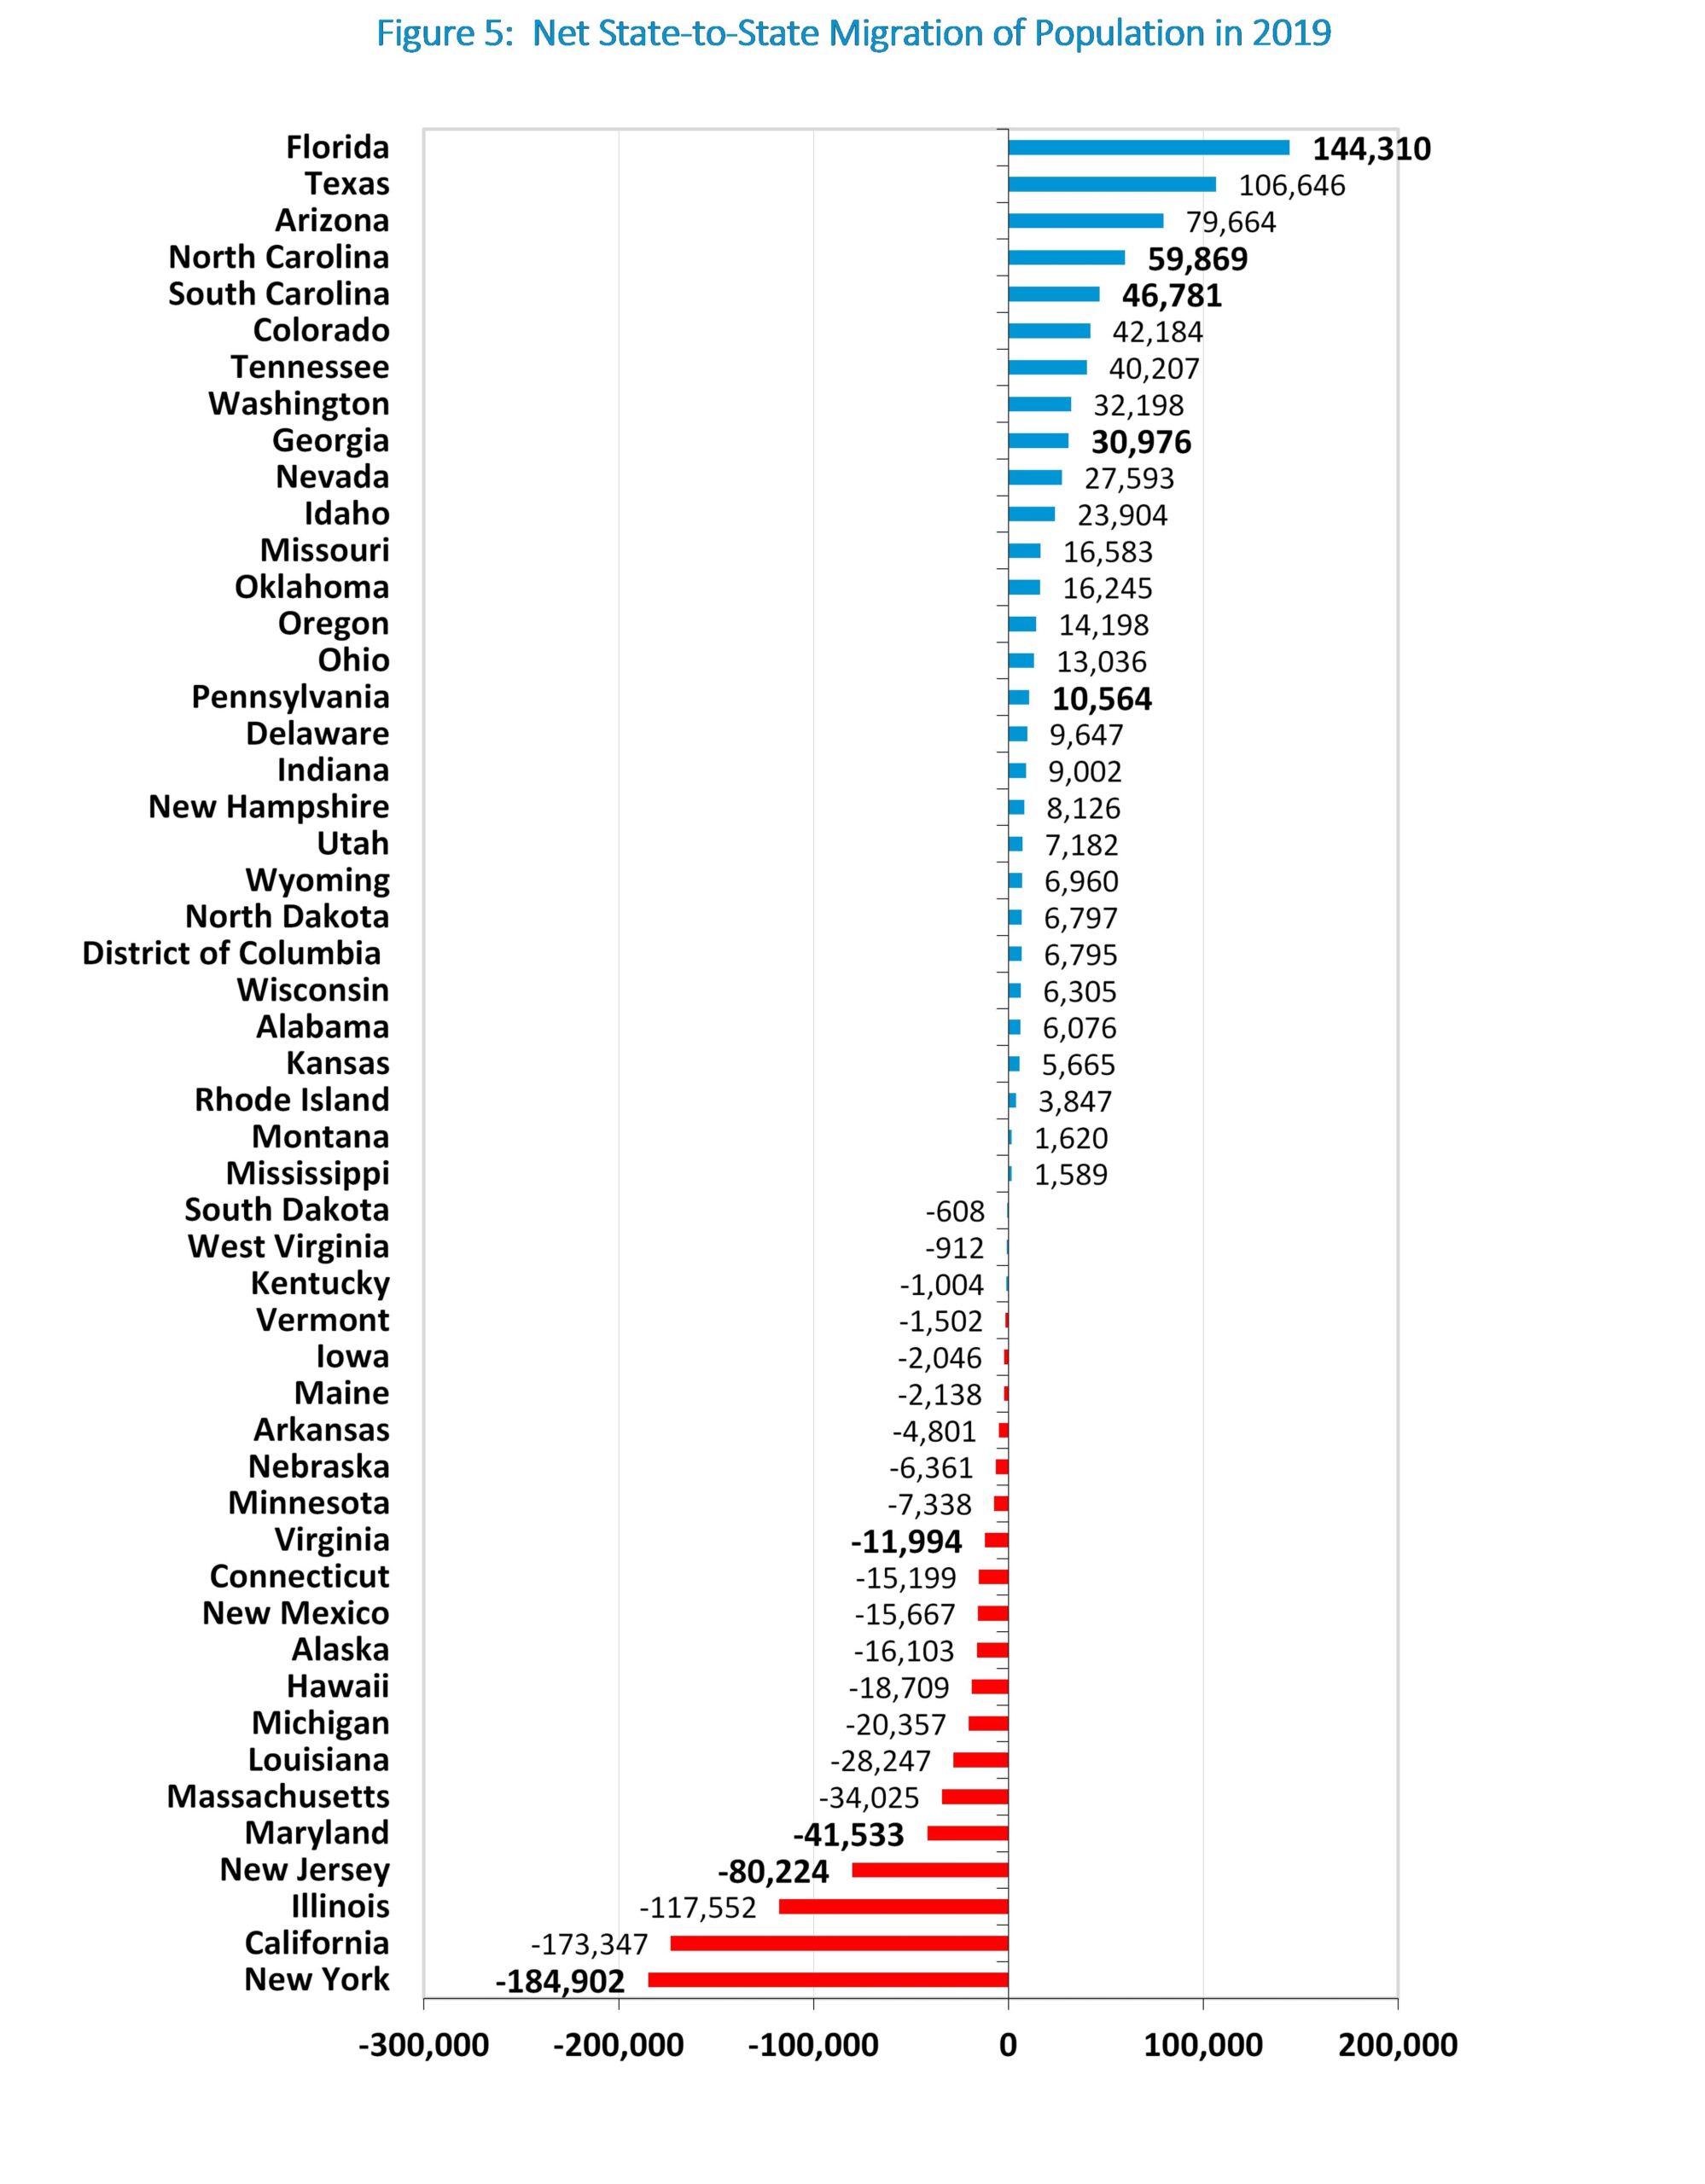
Figure 5 (below) provides data on net state-to-state migration of population in 2019 (the most recent year for which data are available). As these data indicate, Virginia, like all but one of the states in Figure 3, experienced a net out-migration of population in 2019. Where in contrast, all of the states shown in Figure 4 except Virginia topped the list of states experiencing a net in-migration of population in 2019.
In short, Virginia is falling in with bad company.
Notes on Figures 1-4: Data Source: Bureau of Labor Statistics. We use seasonally unadjusted data in this chart to capture year-over-year changes in employment more accurately. Figure 5: U.S. Census Data.
A. Fletcher Mangum, Ph.D, is founder and CEO of Mangum Economics and a member of Virginia’s Joint Advisory Board of Economists.
Leave a Reply
You must be logged in to post a comment.