
by John Butcher
The estimable Jim Bacon points out that the (already inflated: see below) graduation rate this year was higher than the pre-COVID 2019 rate, despite the effect of the pandemic and the government’s response to it. The Virginia Department of Education’s excellent new Cohort Graduation Build-A-Table provides a more nuanced look.
The reports we see in the press are the “On-Time Graduation Rate.” This rate “expresses the percentage of students in a cohort who earned a Board of Education-approved diploma within four years of entering high school for the first time.” This rate inflates the count of standard and advanced diplomas by including the modified standard, special, and general achievement diplomas.
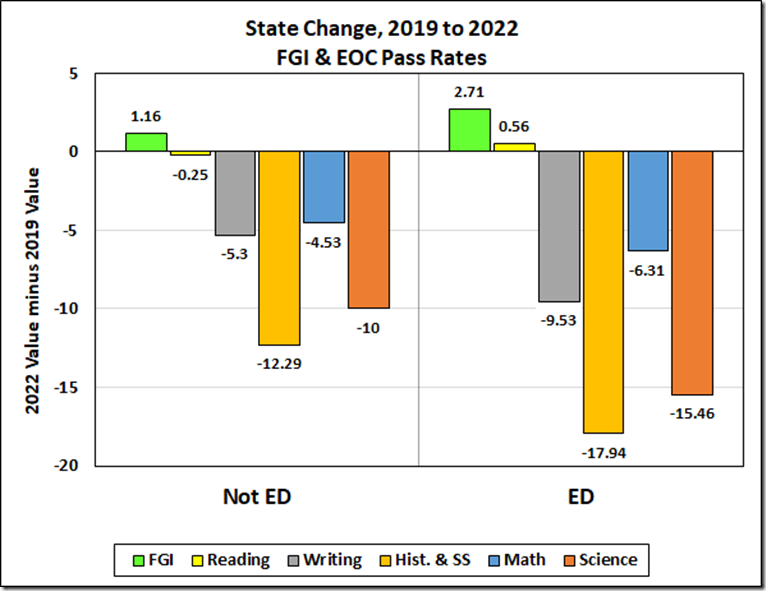
To their credit, the federales want a count of the standard and advanced diplomas, the Federal Graduation Indicator (FGI). Data below are FGI from the 2019 and 2022 4-year cohort reports.
Another wrinkle: “Economically Disadvantaged” (ED) students (essentially those who qualify for the free lunch program) generally score lower on the SOL tests and graduate at lower rates than their more affluent peers (Not ED). Thus, pass rates and graduation rates of the schools and divisions depend in part on the percentages of ED students. The cohort report and graphs below provide data for both groups.
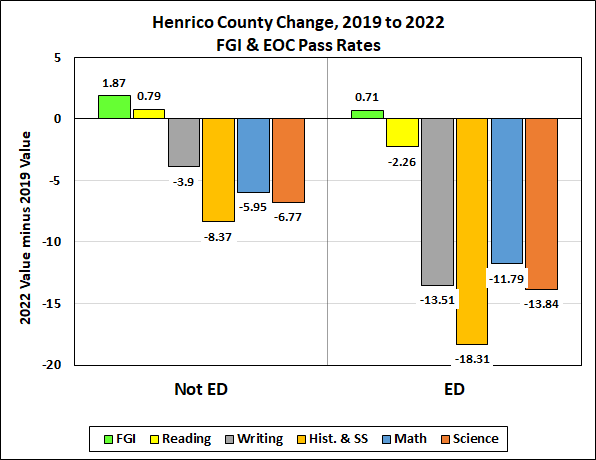
There were no Standards of Learning tests in 2020. The 2021 testing was voluntary; about three-quarters of the students took the reading and math tests; fewer the other tests. So we must look back to 2019 to assess trends. The SOL and graduation data below are the 2022 minus 2019 numbers.
Prior to this year, the standard diploma required six “verified credits,” i.e., passing the end-of-course SOL in six passed courses (reading, writing, math, science, history & social science, and an elective). This year, the elective requirement was dropped. Thus, while the End-of-Course (EOC) assessment pass rates give a measure of success in meeting the requirements for a diploma, the ‘22 diploma rate is boosted in some degree.
Whew!
With all that in place, here are the state data.
The reading numbers are anomalous and there is a reason: starting in 2020, VBOE relaxed the cut scores on the reading tests.
With that in mind, the pattern is clear: plummeting performance and inflated – in fact, mendacious — graduation rates.
Jim’s intuition was dead on.
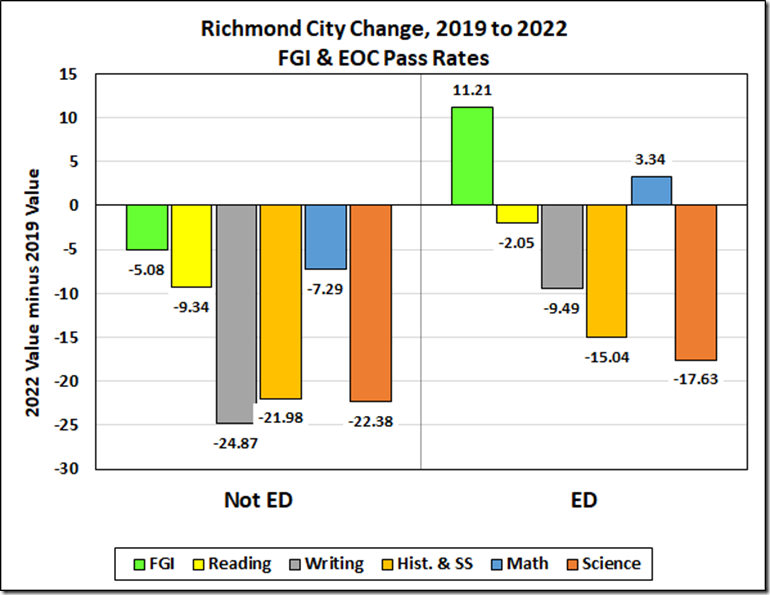
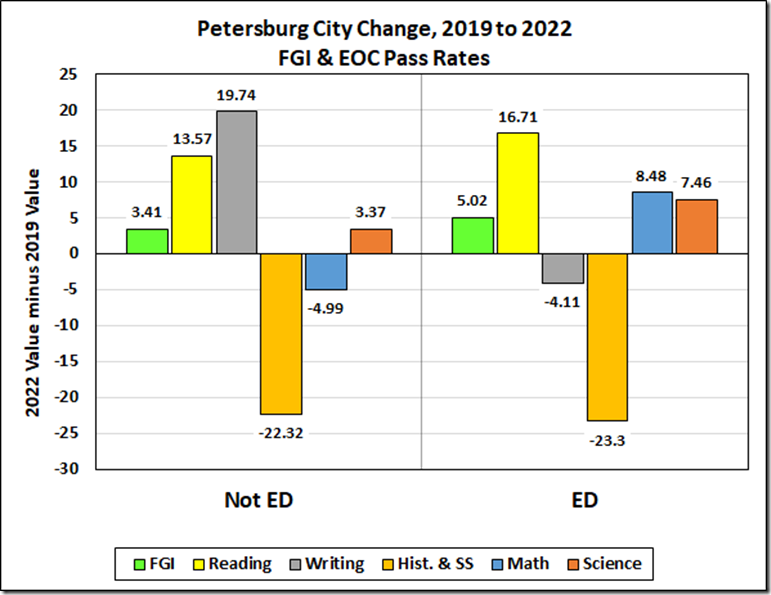
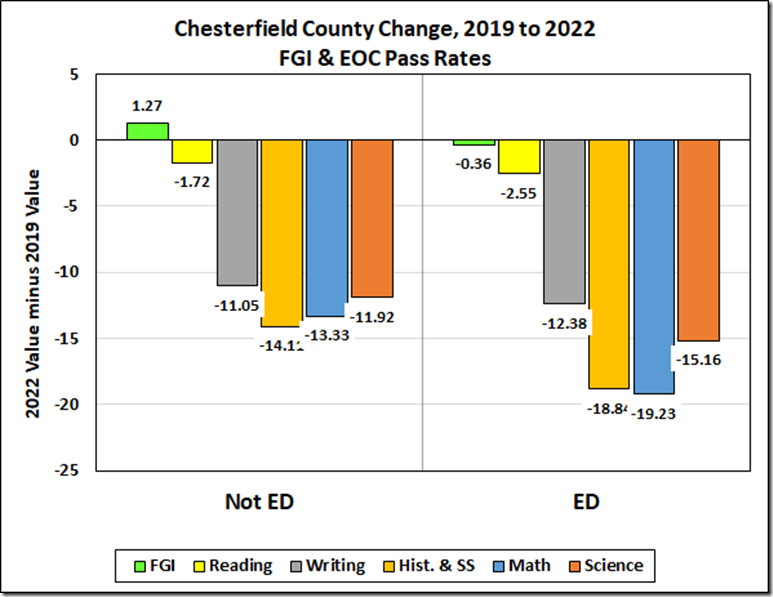
Just because we can, here are some division results.
Even with all that “help” from the Virginia Board of Education, Richmond couldn’t manage to break even in graduating its Not ED students.
Let’s hope this next one means that Petersburg is starting to do something right, at least where it counts most: reading and, to a lesser degree, math.
Chesterfield.
Henrico.
Email cranky1@duck.com if you’d like a copy of the spreadsheet.
John Butcher is a retired attorney living in the Richmond area. This column has been republished with permission from Cranky’s Blog.

Leave a Reply
You must be logged in to post a comment.