

Credit: Bing Image Creator. Letters lighter than air.
by James A. Bacon
After the U.S. Supreme Court issued its ruling restricting the use of race as a higher-ed admissions criteria, University of Virginia President Jim Ryan and Provost Ian Baucom released a statement proclaiming that they would do everything in their power to admit a class of students that is “diverse across every possible dimension.” That commitment extended not just to race, ethnicity, and gender, they proclaimed, but “geography, socioeconomic status, first-generation status, disability status, religion, age, sexual orientation, viewpoint, ideology, and special talents.” (My italics.)
Some of those dimensions have occasioned far more attention than others. For example, UVa has put into place a large Diversity, Equity & Inclusion bureaucracy to advance racial/ethnic diversity. By contrast, far from promoting viewpoint and ideological diversity, university practices — hiring of left-of-center faculty, mandatory DEI statements and Student Guide tours — serve to drive off prospective students and faculty who are conservatively inclined.
In this post, I will argue that the Ryan administration pays little more heed to the geographic and socioeconomic criteria on its checklist than it does to viewpoint and ideological diversity. Students from poor households and rural households are severely underrepresented. But UVa does not care enough to even track their numbers.
Before proceeding any further, let me stress that I am NOT calling for UVa to “look like Virginia” based on geographic and income criteria. Rather, my purpose is to demonstrate the contradictions between President Ryan’s musings about diversity, which are designed to defuse the controversy over racial preferences, and UVa’s actual practice.
Past posts have provided detailed breakdowns of UVa entering classes by race and ethnicity. Those numbers are readily available because the racial/ethnic composition of the student body is what UVa officials most care about, what they make a point of measuring, and what they publish on the university website to hold themselves accountable. However, the university posts no statistics regarding the geographic divides in the student body — rural versus urban versus suburban — much less a breakdown of family incomes in its diversity dashboard.
If we believe the dictum that “you manage what you measure,” the disinterest in geographic and income statistics suggests an indifference toward those categories of diversity in practice.
Fortunately, thanks to data found on the State Council of Higher Education for Virginia (SCHEV) database, it is possible to calculate the geographic disparity in the student body. SCHEV breaks down the locality of origin for in-state undergraduate students for all of Virginia’s public higher-ed institutions, including UVa.
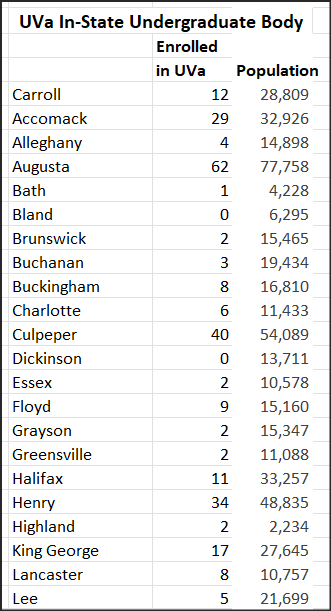 Of the 10,306 in-state undergrads enrolled at UVa in 2022-23, 556, or 5.1% of the total, come from localities designated by the U.S. Census Bureau as “rural.” Those 51 localities accounted for 1,056,000 of Virginia’s 8.6 million population, or about 12.1%. Another way of expressing the geographic disparity in the student body is to say that inhabitants of rural areas account for only 42% of the number we would expect if they were represented proportionately.
A common justification given in UVa’s diversity literature for increasing the percentage of racial minorities is that people of diverse backgrounds bring different 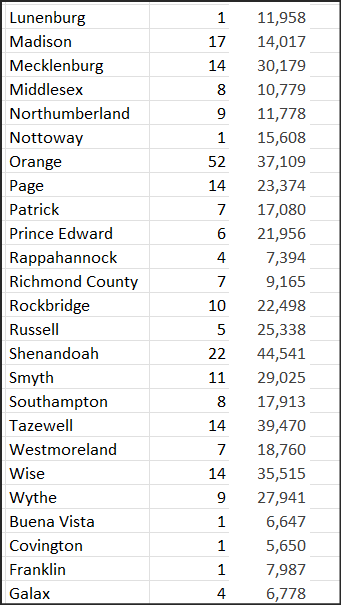 experiences and perspectives that add richness to the intellectual climate. There’s much to be said for that logic. But how different are the life experiences of a Black kid and a White kid parented by white-collar parents in a suburban environment? And let’s be honest here, most of the Black kids admitted to UVa are middle class, not from downtrodden inner-city communities. If you’re looking for a diversity of viewpoints, you’re far more likely to get that from a kid from a farming community, a coal camp, or a mill town.
The under-representation of rural youth dovetails with the under-representation of students from poor 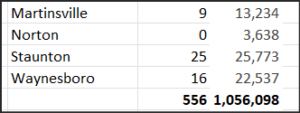 families. UVa does not publish a socio-economic breakdown of the student body. Admittedly, administrators collect family income data only for students applying for student aid, therefore, there is no way to know the income of families that pay their own way.
However, a study conducted by Raj Chetty, a Harvard economics professor, and four co-authors managed to track 30 million students born between 1980 and 1991, and link anonymized tax returns to attendance records from nearly every college in the country. The study, published in 2017, found that at elite universities, the number of students from families in the top 1% of family incomes far exceeded the number from the entire bottom quintile. Here is the summary for UVa as published in the New York Times:
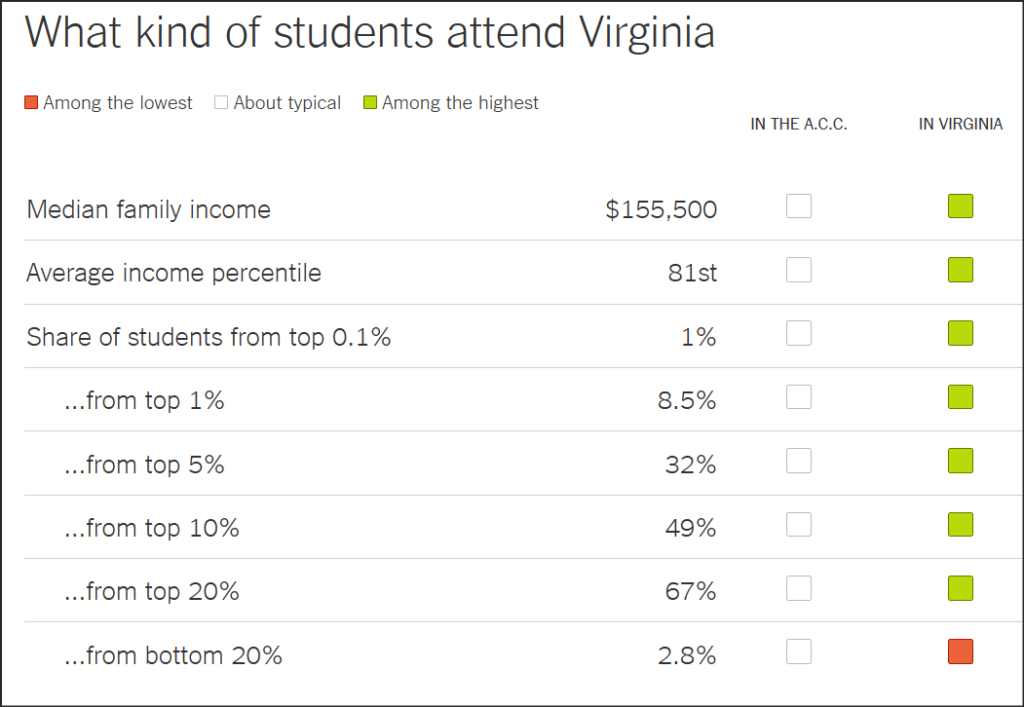
The income gap at UVa is less acute than it is for the snootiest of America’s private liberal arts colleges but it’s far more skewed toward affluent households than most public universities — a fact for which it has been lambasted by left-of-center critics. Students from families with top income quintile (top 20%) accounted for two-thirds (67%) of the student body compared to measly 2.8% for students from the bottom quintile.
The university does address socioeconomic disparities in one way: The UVa Promise guarantees that 100% of a student’s demonstrated financial need will be met through loans, Pell grants, and scholarships. Leftist critics are not impressed: Only a modest percentage of the student body qualifies for this generous support. Other public universities admit far more poor kids. Chetty’s data is six years old, however, so we don’t know if the percentages he published for UVa are current.
However, a different metric suggests that nothing has changed. SCHEV publishes income data for students receiving financial aid at Virginia higher-ed institutions. Here is the income distribution of UVa’s first-year students with demonstrated financial in the most recent academic year reported, 2021-22:
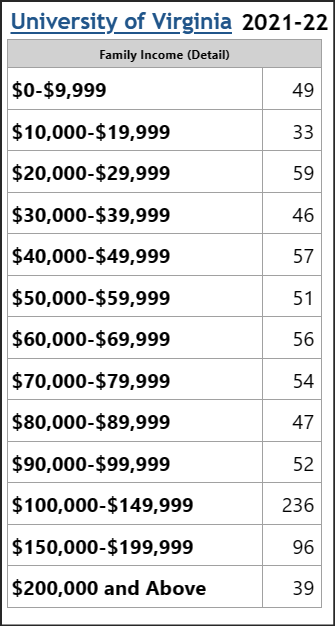
That’s out of a class of 4,030.
From these numbers, we can estimate that about 9% of the entering first-year class in 2021-22 came from families earning less than the median family income in Virginia of $81,000. Compare that to 2018, the year Ryan assumed the presidency. About 11.6% of the entering class came from families earning $70,000 or less in a year when Virginia’s median household income was $72,500. In other words, UVa became less socioeconomically diverse under Ryan.
At the Jefferson Council, we’re not inclined to see income as a critical component of diversity. UVa is Virginia’s flagship university. It has the highest academic standards in Virginia (though some William & Mary alumni might beg to differ), only high school students with high levels of academic aptitude amd background are likely to thrive there. And the fact is that Virginia’s high-achieving students come disproportionately from higher-income households in suburban communities, especially those in Northern Virginia. As much as we’d like to see geographic and income diversity in the abstract, we believe that admissions should be based first and foremost upon merit (however that is defined — a subject for a different post).
UVa’s president has professed his commitment to diversity across “every possible dimension,” including geography and socioeconomic status. But UVa doesn’t measure those forms of diversity any more than it tracks or measures viewpoint diversity. The administration is preoccupied with race/ethnicity, not geographic origin, not income level. Pronouncements that UVa is committed to “every possible dimension” of diversity are empty words.

