
 by Dick Hall-Sizemore
Some participants on this blog have voiced skepticism regarding the claim that Black drivers are more likely than white drivers to be pulled over by law enforcement. Jim Bacon even went to great lengths to demonstrate that it was difficult to determine the race of a driver in a moving vehicle. These skeptics have called for some data to support the claim, rather than relying on single egregious incidents such as the one that occurred in Windsor last year.
That data is now available and it supports the hypothesis that Black drivers are more likely than white ones to be stopped for traffic infractions.
Using recently available data from the Dept. of State Police, the Richmond Times Dispatch has calculated that “drivers who are Black are 1.6 times more likely to be stopped than white drivers based on their respective populations. And once stopped, Black drivers are 1.6 times more likely to have their car searched than white drivers and 1.3 times as likely to be arrested.”
The data was collected as a result of the Virginia Community Policing Act (HB 1250, 2020 Session). The legislation required any law-enforcement officer in the Commonwealth to collect the following data for each motor vehicle stop:
- Race, ethnicity, age, and gender of person stopped;
- Reason for the stop;
- Whether a warning, written citation, or summons was issued or whether any person was arrested;
- If a warning, citation, summons or arrest was issued or made, the warning provided, violation charged, or crime charged; and
- Whether the vehicle or any person was searched.
In addition, the law requires each state and local law-enforcement agency to collect the number of complaints the agency receives alleging the use of excessive force. The data collected is to be entered into a database developed and maintained by the Dept. of State Police.
Finally, the Dept. of Criminal Justice Services (DCJS) is directed to analyze the data to “determine the existence and prevalence of the practice of bias-based profiling and the prevalence of complaints alleging the use of excessive force.” DCJS is required to report to the General Assembly annually on its findings and recommendations resulting from its analysis.
Focusing on the Richmond region, the RTD analysis found that more motorists were stopped in Chesterfield County than in any other locality except for Fairfax County. (Chesterfield is the fifth-largest locality in population in the state.) Although it had the smallest population in the region, Hanover County saw more traffic stops than either Henrico County or the city of Richmond.
The chance of a Black driver being stopped versus that of a white driver was higher by far in Hanover— 5.2 times more likely. Black drivers were also more likely than white drivers to be stopped in each of the other jurisdictions, as well —Richmond, 2.4 times more likely; Chesterfield, 2.3 times more likely; and Henrico, 1.6 times more likely.
Region wide, Black drivers accounted for 55% of arrests and 64% of vehicle searches.
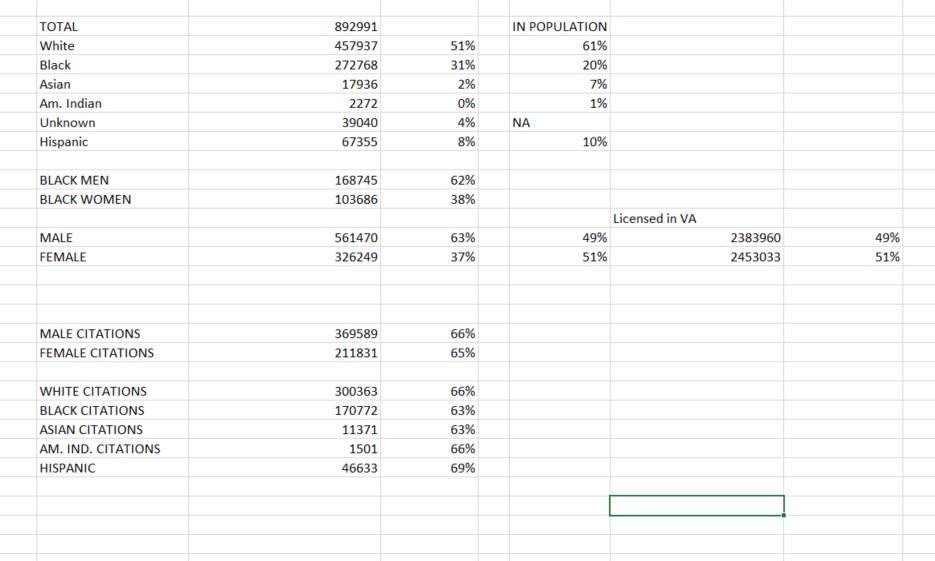
The State Police database can be found here. For the period from July 1, 2020, to June 30, 2021, there is data for 878,190 traffic stops from 314 law-enforcement agencies across the state. That is a lot of raw data, but the site does provide the ability to filter the data. However, the filters are not the most user-friendly.
The statewide data can be downloaded into an Excel spreadsheet. I was going to attempt to analyze it, but my pivot table skills are virtually nonexistent and I do not want to take the time needed to get up to speed. The RTD came to my rescue. For more statewide analysis, I will wait for the DCJS report; the data folks at that agency are good.
My Soapbox
Unless one is prepared to maintain that Blacks are disproportionately worse drivers than whites, in light of this data it is hard to argue against the proposition that there is some systemic bias against Black drivers among law enforcement.
Furthermore, the proportions used in the RTD analysis are based on the racial composition of the general populations. If the analysis were based on the racial composition of the driving population, the bias might be shown to be stronger. Because race or ethnicity is not included in the information on a Virginia driver’s license, it is likely very difficult, if not impossible, to obtain the data needed for that level of comparison.
Leave a Reply
You must be logged in to post a comment.