
by John Butcher
It’s Spring and the data in the lower half of the 2020 Superintendent’s Annual Report have sprouted.
Table 19 reports on salaries in some detail. As well, it provides an overview report of division average salaries of “All Instructional Positions” (classroom teachers, guidance counselors, librarians, technology instructors, principals, and assistant principals). Here is a summary of those summary data:
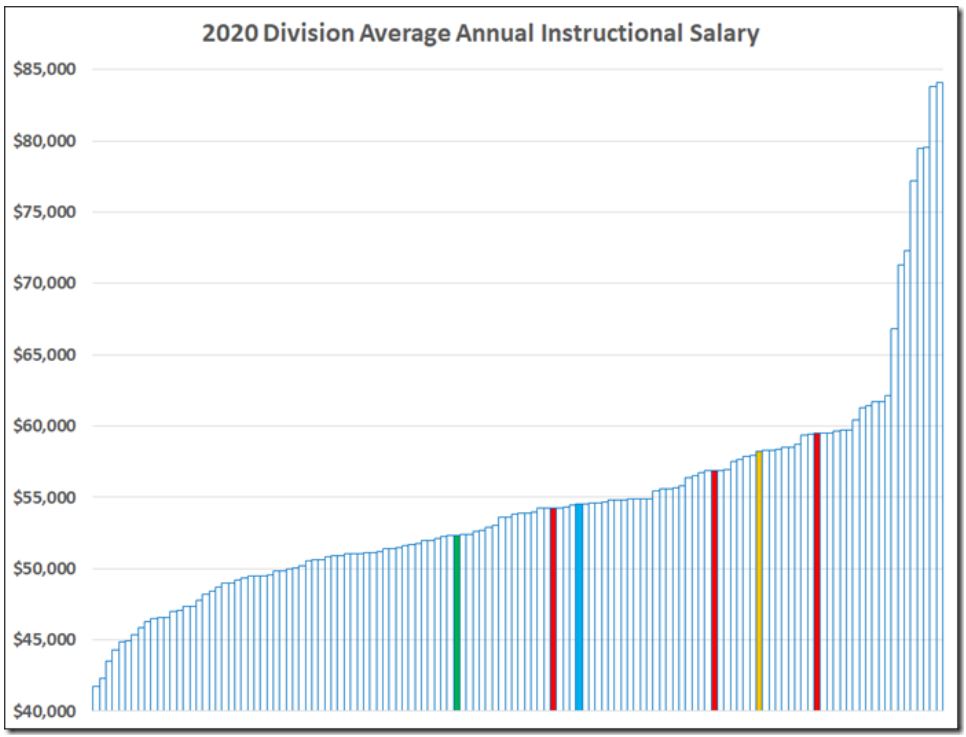
The gold bar is Richmond. The red bars are the peer cities, from the left Hampton, Newport News, and Norfolk. The blue bar is Northumberland, which is just a few dollars above the division average. The green bar is Lynchburg (with a hat tip to James Weigand).
Here is a list of the eight Big Spenders, along with the Richmond peers and two averages. The right hand column is the difference from the division average.

Falls Church leads the pack with an average salary 54.4% above the division average.
The “Teacher Average” is the average salary over all instructional personnel, while the “Division Average” is the average of the division averages. The former number is much larger, primarily because of the higher salaries and larger numbers of personnel in those large NoVa divisions. Notably: Fairfax has 16,363.92 positions (I’d like to meet that 0.92 person) at a $79,554 average.
Finally, here are Richmond and the suburbs.

This column is republished with permission from Cranky’s Blog.
Leave a Reply
You must be logged in to post a comment.