
by John Butcher
The 2023 4-year cohort graduation rates are up on the Virginia Department of Education Web site.
VDOE likes to report its “On-Time Graduation Rate” because it inflates the numbers by counting the nonstandard diplomas. The data below are the “Federal Graduation Indicator” that counts only the Standard, Advanced, and IB diplomas.
On average, Virginia’s economically disadvantaged students (ED) (mostly students who qualify for the free/reduced price lunch program) graduate at rates ca. 9% lower than their more affluent peers (Not ED). The handy VDOE database provides data for both groups.
To start, here are the division average federal ED rates plotted v. the Not ED.
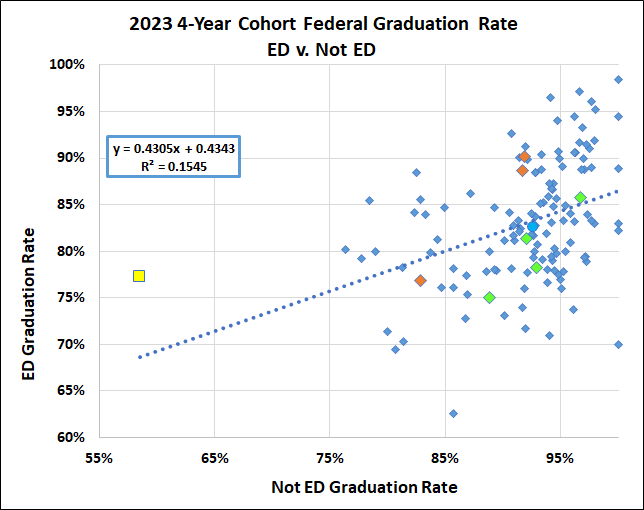
The gold square is Richmond. The orange diamonds are the peer cities, from the left Norfolk, Newport News, and Hampton. The green diamonds are the Richmond ‘burbs, from the left Charles City, Chesterfield, Henrico, and Hanover. The aqua circle is the state average (average over all students, the averages of the division averages are slightly different, see below).
The fitted line (with the state average removed and Highland not showing because of the suppressed ED datum) confirms what our eyes tell us: The ED rate is only slightly correlated with the Not ED.
Let’s take a different look at that scatter: ideally, all the data points would lie at (100,100). This being the Real World, some divisions will have less than perfect graduation rates, so the next-to-ideal situation would have equal rates for the two groups in a given division. That would put all the data on the line from (0,0) to (100,100).
If we put that line on the graph, and toss in as many division names as won’t create an unreadable mess, we get:
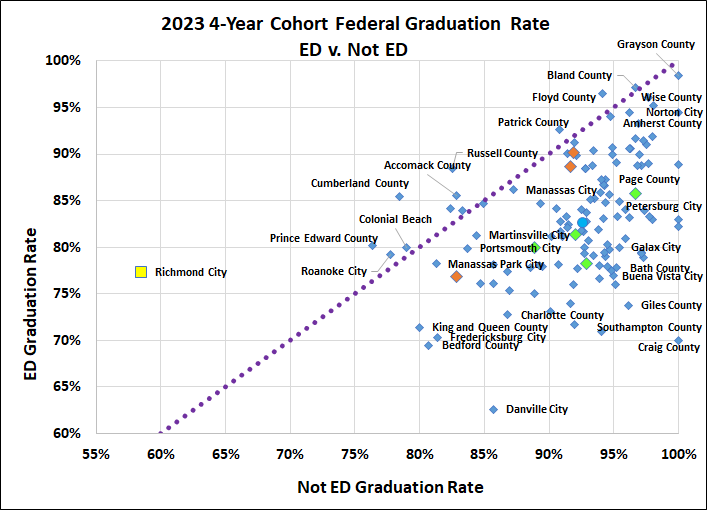
The divisions below the line have Not ED rates larger than ED. Some, as we see, are much larger.
The divisions above the line show the abnormal situation with ED graduation rates larger than the Not ED. We might expect that the natural statistical variability would explain that in a few very small divisions, e.g., Colonial Beach with 27 students. But Richmond? Roanoke? And, none of those other divisions above the line is nearly as small as Colonial Beach.
In any case, those divisions near the top end of the line are graduating larger percentages of their students. Notice the sampling there of Region VII division rates (notably Bland, Grayson, Norton, Russell, and Wise; less notably Giles). We might wonder why our Board of “Education” is not looking more closely at what those Region VII schools are doing.
Looking from another angle, here are the ED and Not ED rates as functions of the percentage of ED students in the cohort.
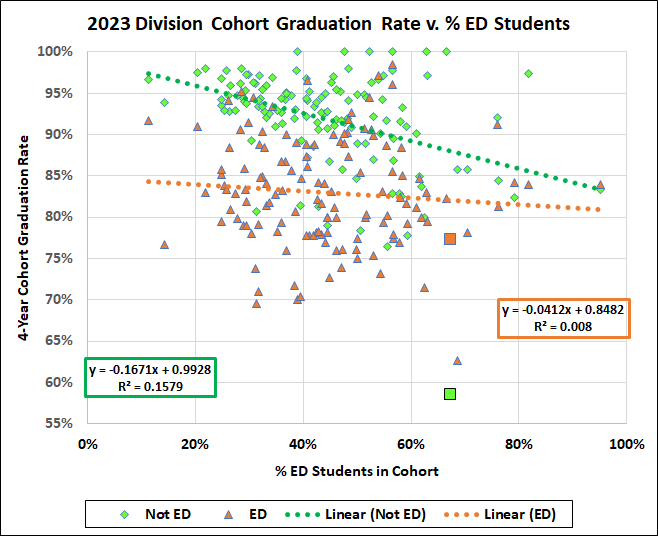
The 1% R-squared value for the line fitted to the ED data tells us that the ED graduation rate is essentially uncorrelated with the percentage of ED students in the division. As to the Not ED students, however, the 16% R-squared tells us there is some correlation. We get to speculate about the basis of that correlation (and the difference between it and the ED value) but, of course, these data do not tell us about causation.
The only clear takeaway is that, as to Ed and Not ED graduation rates, some divisions do very well, some do not, some do well with one group and not with the other, and there are no strong relationships in these data. There is one clear implication, however: our Board and Department of Education do not know how to improve these rates.
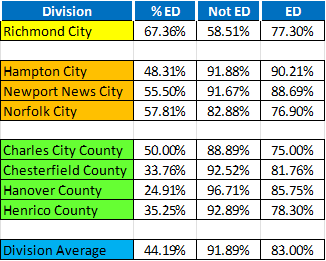
Here are the numbers for Richmond, the ‘burbs, and the peers:
And here, for your Reading Pleasure, is the entire list:

Republished with permission from Cranky’s Blog.
Leave a Reply
You must be logged in to post a comment.