

Rankings among 794 locations.
Fascinating data from Governing magazine comparing auto dependency of various municipalities around the United States: Arlington, Alexandria and the City of Richmond led the pack in Virginia as the least auto-dependent, with Norfolk, Lynchburg and Roanoke close behind.
There are two main variables affecting automobile dependency: income and availability of transportation alternatives.
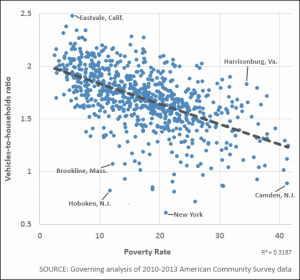 Income: Poorer communities, or those with large concentrations of poverty, tend to have more car-less households and fewer cars per family. These households are more likely to car pool or avail themselves of whatever non-car alternatives exist, typically municipal bus systems. As the Governing scatter chart to the left shows, there is a significant correlation between the poverty level and the vehicle-to-household ratio. Note: Governing identified Harrisonburg as an “outlier” having both a high poverty rate and high rate of auto ownership.
Transportation alternatives: Core urban jurisdictions have the best developed transportation alternatives. In Virginia, traditional cities (and Arlington County) tend to be highly walkable and have access to mass transit.
By way of comparison, New York has the lowest rate of auto dependency in the country — o.6 vehicles per household.
— JAB

