
 The New York Times has published an awesome tool for visualizing human settlement patterns. I could play with it all day long! The tool, “Mapping America: Every City, Every Block,” breaks down the nation into Census tracts and displays the population with a dot for every 1,000 people in the map scale seen to the left. (As a cool aside, the dots are color coded by race, making it possible to get a sense of how segregated or integrated different communities are.)
Thus, we can see that the New York metropolitan area — the NY Times’ home turf — is one of the mostly densely settled, if not the most densely settled, places in the country.
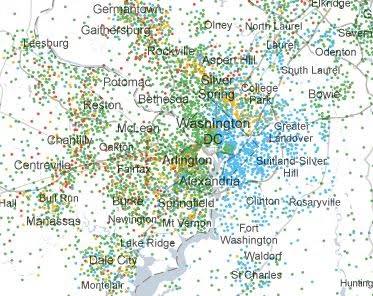 We can also see that the Washington metro- politan area, by national standards, is densely populated in the urban core but that the human settlement patterns outside the core are highly scattered, both on the Virginia side of the Potomac as well as the Maryland side. This vivid, high-altitude view (which is the same scale, by the way, as the New York map above) depicts what people imprecisely refer to as “suburban sprawl,” or what EMR and I refer to as scattered, disconnected, low-density human settlement patterns.
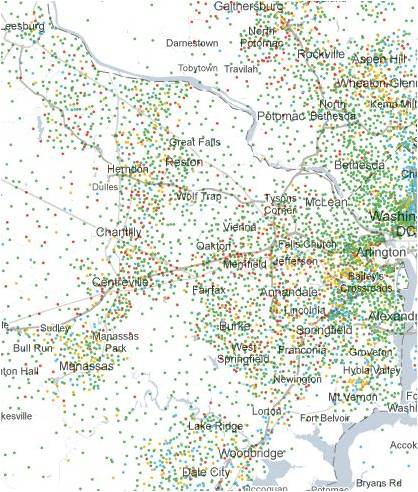
Now, let’s zoom in for a closer look at the Virginia side of the Washington metro area. Here we can see the truth in EMR’s oft-stated dictum that if all of Northern Virginia were settled as compactly as Arlington and Alexandria — hardly examples of dystopic density — the entire population could fit into an area the size of Fairfax County. If the region’s population were that compact, imagine the possibilites for creating the same kind of alternative transportation systems — both bus and heavy rail — that allows Arlington to boast of the highest rate of mass transit ridership in the country outside of New York! (At this scale, one dot equals 500 people.)
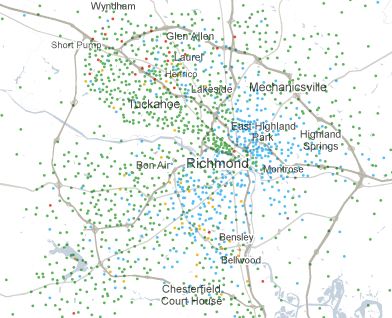
Finally, let’s take a look at RoVa (the Rest of Virginia), in particular my home town of Richmond, which I love dearly in nearly every way but its extraordinarily inefficient human settlement patterns — a flaw that ultimately may prove to be its economic undoing. Here you can clearly see two small patches of moderate density development (in the Fan, the blue patch, meaning mostly white people live there, and in Church Hill, the green patch, meaning mostly African-Americans live there). You can see low-moderate density in western Henrico County (the upper left-hand quadrant), while the rest is extraordinarily low-density development. Richmonders periodically fantasize about supporting light rail transit but, as the maps shows, the scattered, low-density distribution of the population makes the idea a cruel delusion.
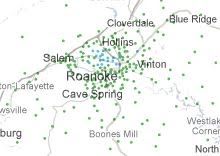 Hampton Roads is no more densely settled than the Richmond area, if you care to check the map. Smaller cities like Roanoke, Lynchburg and Charlottesville are even lower density. Just imagine how expensive it is to provide infrastructure and municipal services to a such a scattered, low-density population. Yes, there are costs associated with providing services to people in an extremely dense environment, too. I’m not suggesting that Virginia should let its urban cores evolve into mini-Manhattans. But I am suggesting that the sweet spot for providing infrastructure is a density comparable to that in Arlington and Alexandria.
