
By Dick Hall-Sizemore
This report on the capital budget section of the budget bill is later than I had planned. There is so much going on with the General Assembly this year. I was familiar with the term “like trying to drink from a fire hose.” Now, I know the experience.
Debt
Because the vast majority of capital projects are funded with tax-supported bond proceeds, any discussion of the capital budget proposals needs to start with the Commonwealth’s debt picture. (The source of the data on the debt is the latest annual report of the Debt Capacity Advisory Committee (DCAC). Anyone wanting a clearly written explanation and discussion of the Commonwealth’s debt status can find the report here.)
Outstanding tax-supported debt of the Commonwealth more than doubled over the last ten years, from $10.6 billion (FY 2010) to $21.7 billion (FY 2019). This total is comprised of debt issued for general construction and for transportation facilities, as well as pension and other post-employment benefits liabilities.
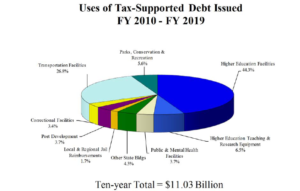
The largest segment of the state’s outstanding debt, and the one that will be the focus of this post, is that issued by the Virginia College Building Authority (VCBA), the Virginia Public Building Authority (VPBA), the Commonwealth Transportation Board (CTB), and the Virginia Port Authority for construction of the physical infrastructure of the state.
As shown in the chart above, about half of the tax-supported debt issued in the last ten years was for higher education facilities and teaching/research equipment. Over a quarter was for transportation facilities. The remaining quarter was divided among other state agencies and local and regional jails.
This category of debt has been growing at a fast pace. The outstanding balance increased 74% over the past 10 years. There was a 5% increase between FY 2018 and FY 2019. Because there is a gap between the authorization of bonds and their actual issuance, this recent growth rate portends higher growth in the future. As the DCAC report notes, The large fiscal year 2018 and 2019 authorizations have not had much impact to the currently outstanding … debt, but the authorizations will have a significant impact on the debt in future years.”
Of course, the amount of outstanding debt is important because it must be paid off. Amounts paid annually for debt service have increased over the last ten years, on both an absolute basis and as a percentage of blended revenues. (“Blended revenues” are comprised of general fund revenues, certain recurring non-general fund transfers including ABC profits, state revenues in the Transportation Trust Fund (TTF), Virginia Health Care Fund revenues, the relevant portion of sales tax and certain recurring non-general fund Appropriation Act transfers.) In FY 2019, tax-supported debt service was a little over $1.0 billion. The DCAC projects that the debt service on all currently authorized and issued bonds will peak at about $1.2 billion in FY 2024 and then decline to about $1.05 billion in FY 2029. The current budget bill includes $1.08 billion for FY 2021 for tax-supported debt service and $1.16 billion for FY 2022. General fund appropriations account for $874.2 million and $890.3 million, respectively, of those totals. The remainder is transportation-related revenue.
Debt Capacity
In order to help prevent its outstanding tax-supported debt burden from becoming so large that the debt service significantly limits the state’s ability to meet its other needs, the Commonwealth has adopted a self-imposed limit on debt services as a percentage of revenues. That limit is an annual average of 5% over a 10-year period. That is, the amount spent on tax-supported debt service will not exceed 5% annually over the ensuing ten years. Adhering to this debt capacity limit is one of the key components in the state’s maintenance of its AAA bond rating. (For more on debt capacity, see my post last year.)
In developing the debt capacity model this year, the DCAC was somewhat conservative in its revenue assumptions. Although it used the basic December 2019 revenue forecast prepared by the Department of Taxation, it excluded those revenues resulting from the federal Tax Cuts and Jobs Act, due to those revenues being, for now, temporary, with an expiration date of 2025. The assumptions do include the anticipated revenues from the Governor’s proposed increase in the tobacco tax, but do not include the effects of the proposed changes in transportation taxes or the tax on games of skill.
The DCAC debt capacity model shows that the state could issue $764.7 million in additional debt in each of the next ten years and remain within the 5% average limit. Debt service as percentage of blended revenues would exceed 5% in three of those years, but would be below 5% in the other years.
This model ignores reality. There is enough debt already authorized, but not yet issued, to make it unlikely that the state will issue much less than $1 billion annually for the next few years, particularly considering the amount of new authorizations being proposed by the Governor in this budget bill (more on that later on). As the report itself notes, “Issuances of below $1 billion in a fiscal year have only occurred four times over the last ten years.” (emphasis added) Furthermore, over the most recent five years, the issuances in three of those years, including the most recent two, exceeded $1 billion. Finally, as noted earlier in this post, the authorizations in 2018 and 2019 (both over $1 billion) have yet to show up in any significant amount as issuances.
Up until 2010, the Commonwealth applied its debt capacity model to a two-year cycle. It limited its debt authorizations to keep the debt service at 5% or less in each year over the succeeding two years. In the wake of the 2008 economic downturn, with the resultant decline in revenues, the administration and General Assembly were faced with having no debt capacity left. Consequently, they decided to redefine debt capacity. The result was the adoption of a measure of an annual 5% over a 10-year period.
The advantage of a rolling ten-year average is that one can always project decreases in authorizations and issuances in the future to offset current excesses. Therefore, if the state issues $1 billion in debt in 2021, rather than $764.7 million that is in the model, which is likely to happen, the debt service/revenue ratio is likely to above 5.0 percent, rather than the 4.8% shown in the model. But, that is not a problem because, next year, there will be a new model, with a different ten-year period, with new average limits. The result is that the state is in a different ten-year period each year and policymakers can always say, “We may be over 5% this year and the next couple of years, but the next governor and General Assembly will do better after that and bring that ten-year average in at 5% or less.” Meanwhile, the state continues authorizing debt.
Budget bill
Perhaps buoyed by the increase in state revenues and knowing that this year is the only one in which he can introduce a budget that will be entirely his, the Governor ignored any cautionary words in the DCAC report and recommended a near-record setting amount of additional tax-supported deb authorization in the introduced budget bill.
Including provisions of the caboose bill, the Governor has proposed authorizing $2.7 billion in additional tax-supported debt. This amount is comparable to the amount authorized in 2016. However, there is a significant difference between 2016 and this year. The 2016 authorization came after two years of relatively low authorization amounts, especially in 2015 (a little over $200 million). As a result, there was pent-up “demand.” Conversely, this year’s proposed near-record authorization proposal comes on the heels of the two years of authorizations exceeding $1 billion each.
Higher education facilities are the big winner, as usual, in the budget proposals. Of the $2.7 billion total, at least $1.2 billion is for higher ed. Local water projects was another winner. The Governor proposed authorizing $367 million for these projects, as follows: $182 million for storm water management; $65 million for Alexandria’s combined sewer overflow project; and $120 million for nutrient removal in the Chesapeake Bay watershed. A third big winner was the Department of Conservation and Recreation with $152 million for projects including land acquisition, shoreline erosion, dam rehabilitation, and construction and renovation of cabins at state parks. Following are some additional highlights (in many cases, the amounts are estimates, based on the agency submissions to DPB):
| Amount (in millions) | Agency | Project |
| $260 | Various | Maintenance reserve (major, non-routine maintenance, repairs, and replacement) |
| $93.1 | Various | Equipment for previously approved projects (not included in original appropriations for projects) |
| $80 | State Police | Upgrade of Statewide Agencies Radio System (STARS) |
| $124.4 | Va. Museum of Fine Arts | Expansion and renovation of museum |
| $58.2 | UVa. | Renovation of physics building |
| $51.1 | VMI | Renovation and expansion of engineering and lab facilities |
| $97.3 | Virginia State Univ. | Replacement of Daniel Gym and Harris Hall |
| $76.9 | Norfolk State Univ. | Replacement of science building |
| $30.6 | Norfolk State Univ. | Replacement of physical plant building |
| $97.8 | Radford | Renovation/construction of Center of Adaptive Innovation and Creativity |
| $77.3 | Old Dominion Univ. | Construction of health sciences building |
| $179.8 | Community Colleges | Construction and renovation of facilities on following campuses: Annandale, Northern Virginia; Locust Grove, Germanna; Hampton, Thomas Nelson; Piedmont; Central Virginia |
| $145.7 | Various | Supplement for costs running higher than original estimates; result of good economy |
| $166 | Various | Acquisition and replacement of instructional and research equipment by higher ed institutions |
This is a very large capital budget package. In his briefing of the House Appropriations subcommittee on capital outlay, the committee staff analyst noted, “In total, the proposed budget will use four years of projected debt capacity.”
In anticipation of some readers of this blog immediately blasting a Democratic administration for excess, I want to remind everyone that, during the years 2010-2019, when $10.53 billion in new debt was authorized, resulting in a 74% increase in outstanding debt, Republicans were in charge of the General Assembly. Furthermore, for each capital budget package submitted by a governor, Republican or Democrat, the General Assembly increased it. Building new higher ed facilities is a bipartisan exercise.
My prediction: The General Assembly will cut the Governor’s recommendation for DCR and more than make up for those reductions with additional higher ed projects.
Leave a Reply
You must be logged in to post a comment.