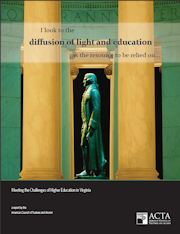
At last we have a critical look at Virginia’s system of higher education — not from within the system itself, or even from within Virginia but from the American Council of Trustees and Alumni. Kudos do go, however, to the Beazley Foundation of Portsmouth for underwriting the report, “The Diffusion of Light and Education: Meeting the Challenges of Higher Education in Virginia.”
The report will not make happy reading for Virginians accustomed to slapping themselves on the back over how the commonwealth has the greatest system of higher education in the country. While Virginia higher ed often does out-perform other states based on metrics highlighted in the report, that’s damning by faint praise. One might as well say, “The lad isn’t so bad. He was only convicted of selling marijuana. He could have been peddling crack!”
Here are some of the highlights.
Core curriculum. The authors examined whether Virginia institutions require students to take general education courses in seven key subjects: Composition, Literature, Foreign Language, U.S. Government or History, Economics, Mathematics, and Natural or Physical Science. Ten public institutions have three or fewer general education requirements, meaning students can graduate, on the taxpayer’s dime, with “vast gaps in their education.” Curricular standouts are James Madison University Hampden-Sydney College, both of which require five of the seven core courses.
Tuition cost. Nationwide, during the six-year period ending in 2010-11, inflation-adjusted tuition and required fees at four-year public colleges increased by an average of 29 percent. At private institutions, they increased by 18.2 percent. Every public institution but Old Dominion University and Virginia State University exceeded the national average. The result of upward creep in tuitions is that at 17 of 38 public and private schools, “tuition and fees now represent more than 40 percent of the median household income. This is a marked increase over the number of institutions that topped the 40 percent mark in 2004-05, a jump from 10 schools to 17.”
Administrative bloat. Nationally, per-pupil administrative costs (up 61.2%) have increased at a far higher rate than instructional (39.3%) or research & service (37.8%) between 1993 and 2007. Virginia is not immune from these trends, although some schools have done far more to curb administrative overhead than others. Virginia Commonwealth University increased 42.9% while Longwood University’s administrative overhead shot up by 131.5%. Only Norfolk State University, which had experienced serious bloat previously, actually managed to cut administrative costs.
Underutilized facilities. There’s nothing Virginia’s colleges and universities like better than statewide bond issues to pay for new buildings. But most universities fail to meet the State Council for Higher Education in Virginia (SCHEV) standard of utilizing classrooms 40 hours per week on average and labs 26 hours. “It appears that Virginia public institutions show a widespread pattern of underutilization of teaching facilities.”
Freshman drop-out rate. State and federal governments spent an estimated $9 billion between 2003 and 2008 on students who dropped out of college during their freshman year. The national average for first-year retention is 79.5 percent for public colleges and 80 percent for private not-for-profit colleges. At the high end, William & Mary and the University of Virginia top the chart with retention rates at 95 percent and 96 percent, respectively. At the low end, four public institutions—Norfolk State, Radford, University of Virginia’s College at Wise, and Virginia State—fall below the national average, with Norfolk State the lowest at 66 percent.
On-Time graduation. Nationally, less than 58 percent of today’s students graduate in six years: 54.9 percent of the students in public institutions and 64.6 percent of the students in private, non-profit colleges and universities. Virginia’s public schools, as a whole, fare better than the national average, graduating an average of 67.9 percent. However, being better than the national average is little cause for celebration. Six-year graduation rates range widely, including the low of 34 percent at Norfolk State to the high of 93 percent at the University of Virginia.
How do we hold public universities accountable? We have a two-tiered system. SCHEV functions as a statewide coordinating body, acting as a gatekeeper for proposed new degree programs and departments. It also creates a strategic plan. But implementation is left up to individual boards of visitors. That’s where they power is.
As citizens and alumni, we must ask to what extent boards function as cheerleaders for the initiatives of university administrations. To what extent do they exercise real oversight? Do boards have real authority, or do they function as rubber stamps? Do board members see their appointments as an honor… or a responsibility? Are board members cronies of the president who look forward to being wined and dined four times a year, or are they truly independent?
That’s where the real analysis comes in, and all the SCHEV and ACTA metrics in the world can’t help us with it. But benchmarking performance can help citizens determine if closer scrutiny is in order.


