

by Dick Hall-Sizemore
The Joint Legislative Audit and Review Commission (JLARC) released a major report last month on the Commonwealth’s K-12 funding formula. The responses were predictable.
On Bacon’s Rebellion, Jim Bacon dismissed the report as a cry for “mo’ money.” Democrats in the General Assembly seized upon the report and its findings as more ammunition in their fight against Governor Youngkin’s effort to cut taxes further.
It is true that the report concludes that the state needs to provide more funding for K-12. However, the report is much more than that. In the report, JLARC documents serious deficiencies in the formula that is used to calculate funding for K-12. It then proposes some significant changes that could be made that would improve the funding system. The report deserves a deeper look on this blog than it has received.
Background
Before turning to the report itself, a review of the background might be helpful. The Virginia Constitution directs the General Assembly to “seek to ensure that an educational program of high quality is established and continually maintained.” The constitution goes on to require that “standards of quality for the several school divisions shall be determined and prescribed from time to time by the Board of Education, subject to revision only by the General Assembly.” Finally, the constitution requires that the funding for the local school systems be shared by the state and the localities. It needs to be noted that the constitution does not define what constitutes “an educational program of high quality” nor does it specify how much of the costs should be borne by the state. Those issues are left up to the General Assembly.
One method of defining the quality of an educational system, and, perhaps, any system, is to look at the system’s outputs. How well have the schools taught the students? What, and how much, have kids learned? With such an approach, the state could use test results to ascertain whether school districts were providing the constitutionally required high quality education. The means a school district used to achieve the results would be up to the division. For example, one requirement could be that XX percent of the students achieve a passing score on a standardized test, with the passing score determined by the state.
The other way of defining high quality would be to focus on the inputs. What do we need to have in place to be reasonably certain the schools would turn out well-educated students?
For better or for worse, Virginia has chosen to define “high quality” education in terms of inputs. The Standards of Quality (SOQ) enacted by the General Assembly in the Code of Virginia set out pupil/teacher ratios, counselor/student ratios, special education teacher/pupil ratios, subjects that must be taught, etc. In effect, the state has said, “This is what needs to be in place to ensure a high-quality educational system.”
Next comes the matter of paying for the high-quality education. The Commonwealth’s policy is laid out in the language of the Appropriation Act. On a statewide basis, the General Assembly has determined that the state will pay 55% of the SOQ costs and the localities 45%. The division of the costs at the individual county or city level will vary according to the locality’s ability to pay. However, the maximum local share is set at 80%.
Finally, there is the need to determine how much it costs to deliver a high-quality education. This is where the JLARC report comes in.
The report
Determining the cost
While considering K-12 funding, it is important to keep in mind that there are two sources of funding for education — the state and the localities. (There is technically a third source, federal funds, but that is a relatively small amount and is not used in JLARC’s analysis.) There are several methods of determining how much needs to be spent to support a high-quality educational system.
The first method would be a comparison of the Commonwealth’s spending with that of other states. On that point, JLARC reports, “Virginia school divisions receive less K-12 funding per student than the 50-state average, the regional average, and three [Kentucky, Maryland, and West Virginia] of Virginia’s five bordering states. School divisions in other states receive 14% more per student than school divisions in Virginia, after normalizing for differences in costs of labor among states.” However, those data tell only how Virginia compares to other states. They do not relate to how much a high-quality education system costs.
Going beyond national and regional averages, JLARC proposes four benchmarks tailored specifically to the Commonwealth:
- Status quo—the total of what was spent by school divisions from state and local revenues in FY 2021 (the most recent year in which complete data were available at the time of the study);
- Virginia staffing needs workshop—JLARC convened seven workgroups comprised of teachers, principals, support staff, central office staff, and program directors. Each workgroup was asked to estimate the type and number of staffing and resources needed to operate high-quality schools. Similar workgroups have been used in 11 states;
- Cost function model—This is an econometric model that predicts K-12 funding needs “using statistical relationships to actual funding, standardized test scores, school division characteristics, and student demographics.” JLARC hired an outside consultant to adapt a nationally recognized econometric model specifically to Virginia. “The final cost function model estimates the funding needed for all school divisions to achieve the 75th percentile on standardized performance tests.” Such models have been used by eight other states recently;
- Best practices—”JLARC staff reviewed funding recommendations from 31 other states and used recommendations from those states to develop a ‘best practices’ funding benchmark.”
Throughout the report, JLARC compares the SOQ estimates of the total cost to each of the benchmarks listed above. In this article, however, the analysis will be largely limited to an examination of the status quo, for a couple of reasons:
- It is the most conservative approach; and
- The other benchmarks involve some level of subjectivity, whereas the status quo benchmark is what was actually spent.
Adequacy of status quo
JLARC reports, “The SOQ formula is intended to calculate the funds needed to provide a high-quality education, but the SOQ total funding is well below actual school expenditures.” [Emphasis added.] That is one of the primary findings of JLARC—instead of funding 55% of the cost of providing a high-quality education, which is the nominal state policy, the state is shortchanging the localities.
The difference between what the funding formula indicated was needed and what was actually spent in FY 2021 was substantial–$66 billion. A likely objection to this comparison would be that some school divisions could be spending more than the minimum needed for a high-quality education. JLARC acknowledges this possibility, but, after analysis, rejects it. “After adjusting for differences in the three major drivers of division costs, only two school divisions spend substantially more than their peers on K-12 education.” Therefore, spending more than is needed “does not appear to be a key reason why SOQ funding is so much lower than actual expenditures.”
There is additional evidence to rebut the contention that school divisions could provide high-quality education within the SOQ requirements but choose to exceed those standards. “Between FY 19 and FY 21, every school division in the state employed more staff than the SOQ formula calculated they needed.” [Emphasis added.] In FY 17 and FY 18, only one school division (Manassas Park) had fewer personnel than the SOQ formula found necessary. It is highly doubtful that, if the SOQ formula provided enough personnel for a high-quality education, every school division would exceed that number.
Most of the JLARC report is devoted to setting out the details of how the SOQ formula underestimates the actual cost of providing a high-quality education. Rather than go through each of these instances, this article will be limited to only a few examples.
The vast bulk of the SOQ costs are related to personnel. There are two components of personnel costs: 1. How many folks are needed? and 2. What is the cost of each one?
The number of staff needed to comply with the SOQ is not set out in one place. JLARC had to analyze the provisions of the Appropriation Act, the Code of Virginia, and the Administrative Code. Furthermore, the standards vary greatly, based on position. For example, in the category, “general classroom teachers,” one teacher per 24 students in K-3 is required and one per 25 students in 4th grade. From there, it gets more complicated.
After crunching all these numbers, JLARC reports “the SOQ formula calculated that 113,800 FTE staff were needed to perform the various instructional, student support, and administrative functions in the K-12 classroom.” However, in FY 2021, school divisions employed 171,400 staff to perform these responsibilities. The actual number was 51% higher than the formula calculated was necessary.
To estimate the cost of these personnel, the SOQ formula needs an assumption that reflects the actual costs, or the “prevailing’ costs. To calculate this prevailing cost, instead of relying on statewide averages based on division averages, the SOQ formula employs a method called the “linear weighted average.” This method weights some divisions more than others. (Ironically, the linear weighted average was adopted as a result of a JLARC recommendation several years ago.)
This method results in “underweight[ing] salaries paid by the state’s largest school divisions, even though these divisions employ a majority of K-12 staff and account for a majority of staffing costs. By underweighting these divisions, the stated calculation of prevailing salaries and compensation costs is biased toward costs incurred by smaller divisions.” As a result, “the difference between SOQ calculated compensation costs and actual compensation costs for SOQ recognized staff (excluding health costs) has been about $1.3 billion.”
Incidentally, the use of the linear weighted average is probably the primary factor behind the imbalance in SOQ funding about which officials from Northern Virginia, and commentators on this blog, as well, have long complained. The numbers are big. According to JLARC, “[T]he average very large division (more than 30,000 students) spent about $139 million on compensation for SOQ-funded staff in addition to what was calculated by the SOQ formula.”
This finding by JLARC could lead to a scenario in which state policymakers decide that, notwithstanding it being below national averages, the total spending is sufficient but the state/local proportion needs to be corrected to the 55/45 split envisaged originally. If the Commonwealth funded, on a statewide average, 55% of the actual cost of operating the schools, the amount of funding that localities would be required to provide would decrease significantly. The amount of spending per student would remain the same but the state would be footing a larger share of the cost.
Localities could divert their savings to other unfunded needs or they could reduce taxes. There will undoubtedly be some cynical readers of this blog who will protest that no government, including local governments, will effectively reduce taxes; rather, they will find a way to spend that revenue suddenly freed up by the higher state contribution for education. The answer to that assertion is that local governments will no longer have the state to blame for the higher amount of local revenue they need to dedicate to K-12. Therefore, members of boards of supervisors or city councils will have to justify to their constituents any diversion of the savings rather than reducing taxes. The residents will render their judgment on the choice in the next election.
In summary, even in comparison to the most conservative benchmark, total actual positions and expenditures, the SOQ formula significantly underestimates the cost of providing a high-quality K-12 educational system. The localities have to cover the entire difference in costs.
Ability to pay
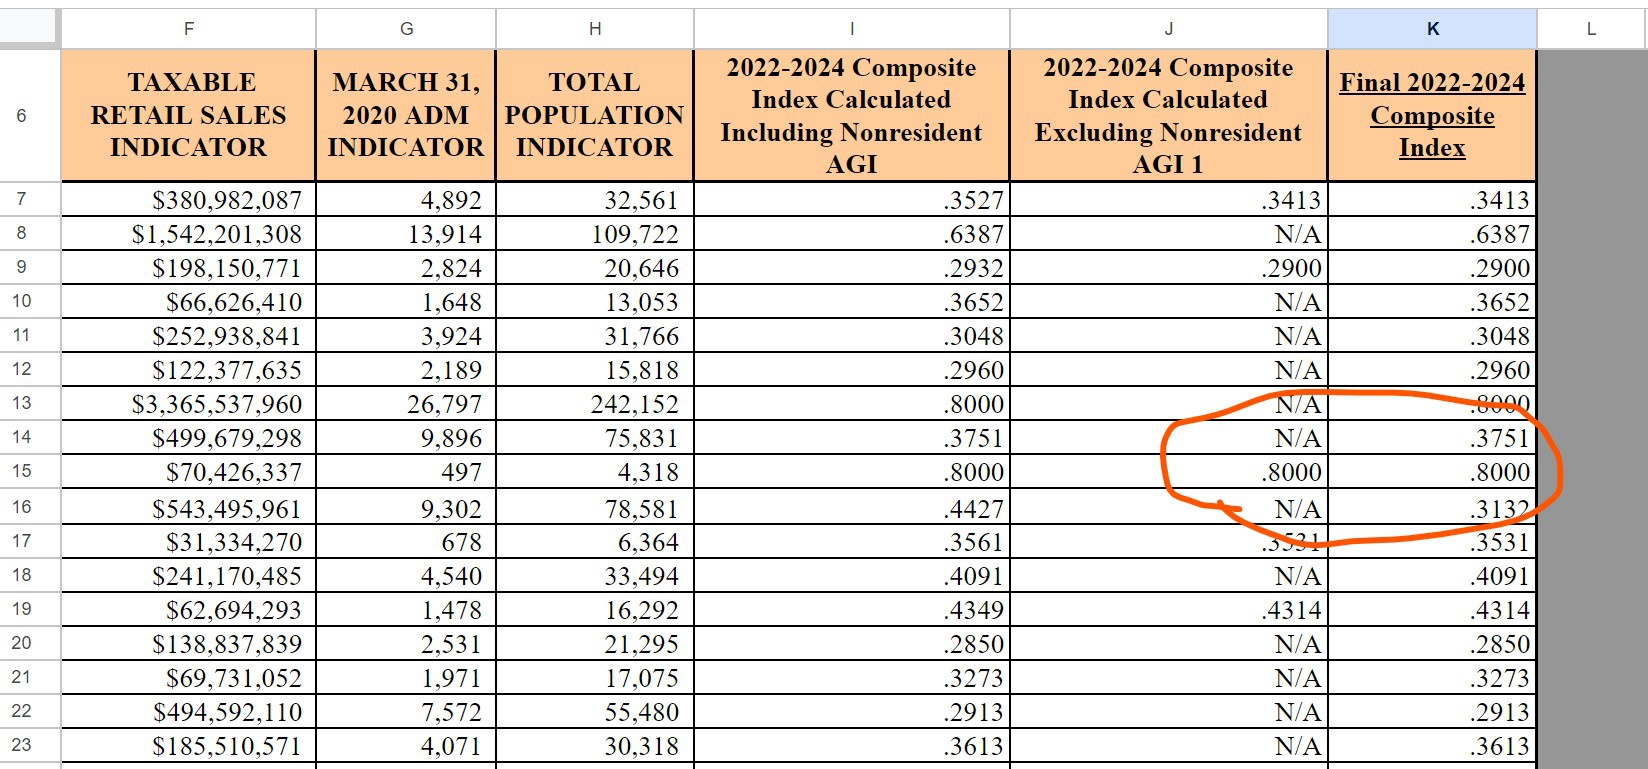
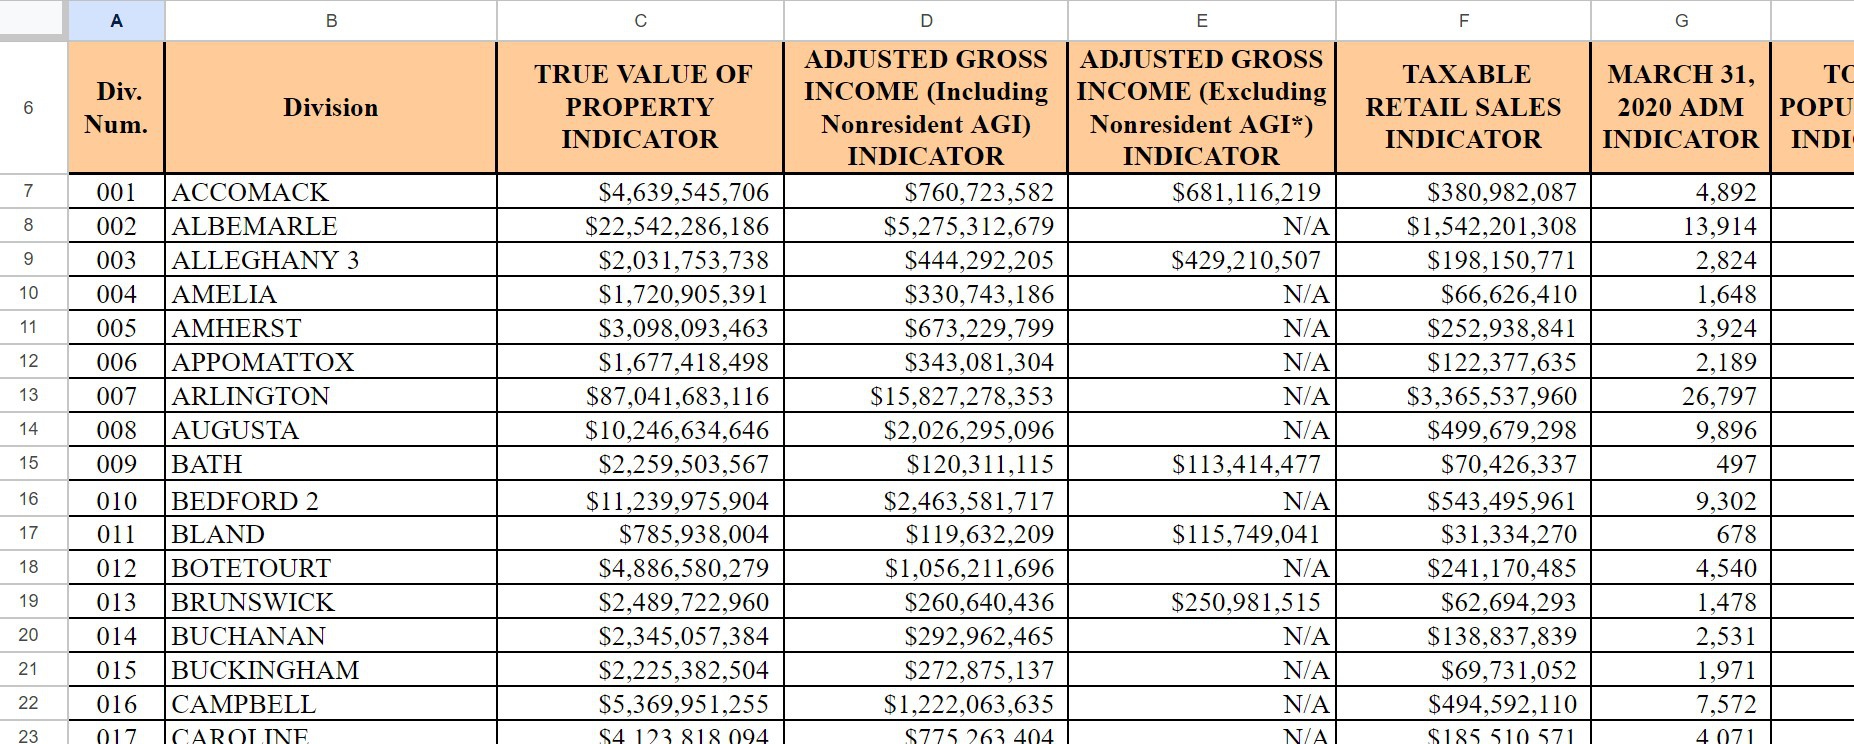
As discussed earlier, the local share of the SOQ formula’s estimate of the cost of providing a high-quality education in a school system is based on that locality’s ability to pay. The local share is determined by the “local composite index” (LCI), which uses a locality’s revenue from real estate taxes, sales tax, and other sources as a proportion of the state totals for those sources.
The composite index has come under criticism in the past, primarily on the grounds that the composition of local government revenue is different now than it was 50 years ago when the index was adopted.
Surprisingly (at least to this author), JLARC concluded, “Despite being 50 years old, LCI remains a reasonable measure of local ability to pay.”
Nevertheless, JLARC did recommend that the state adopt a measure of overall revenue capacity because the LCI is limited in how it measures a locality’s ability to pay. Such a measure was developed by the Commission of Local Government many years ago and is updated annually. The Commission is now a unit within the Department of Housing and Community Development.
Recommendations
In addition to numerous recommendations on dealing with technical issues with the SOQ and updating the SOQ to reflect current conditions, there is a major “policy option.”
The report makes a strong case for junking the current method of calculating the SOQ costs. Currently, the Commonwealth uses a staffing-based formula. The formula determines funding needs by first determining the number of staff needed and then the cost of that staff. Virginia is only one of nine states that use such a method for funding K-12.
The alternative used by 34 states is a student-based formula. In such an approach, the state allocates school divisions a specified amount of funding per student. Seven states use hybrids of the staffing-based approach and the student-based approach or some other method.
Following is a greatly simplified outline of how a student-based funding formula would work. The per pupil amounts (PPA) for each division would be calculated using actual expenditures. The prevailing (base) PPA would be the division average. The PPA to be used in the funding formula for each division would be the prevailing PPA adjusted by several factors such as cost of labor and size of division. The estimated cost of a high-quality education (SOQ) in each division would be the adjusted division PPA multiplied by the number of students. Finally, the division of the cost between the state and locality would be determined by the local composite index or by revenue capacity, whichever is adopted. (For a detailed description, see here. The link takes one to the on-line appendices to the report. Appendix N, starting on page 43 lays out the student-funding formula.)
Costs
The JLARC recommendations come with a hefty price tag. Just to adjust the SOQ formula to reflect the state paying its share of actual expenditures would cost approximately $2 billion in state funding. JLARC calculates that switching to a student-based formula would cost the state $1.2 billion.
If funding is an issue (when is it not?), the JLARC report proposes a change in how the SOQ formula is used. Currently, “the SOQ formula’s staffing and funding calculations do not reflect prevailing practice largely because the formula has been altered on a piece-meal basis by prior governors and General Assemblies based on available revenue for the state budget in any given year.” JLARC recommends that this practice be stopped.
JLARC recommends that, after the SOQ formula is calculated to reflect prevailing practices, “[t]he General Assembly would then determine how much funding is appropriated for the SOQs, using the formula estimate as a guide for what is needed, without making changes to the formula.” This approach would give the General Assembly a “reasonably accurate” estimate of what is needed for a high-quality education system. It could then determine how much to appropriate based on available revenue. One year it might appropriate 40% of the estimate; in another, 50% percent. One could call it “truth in education funding.”
My Soapbox
The Governor and the General Assembly have missed the boat.
Making major changes in major programs is always difficult. There are often significant costs involved. A lot of staff work and analysis are needed to guide policymakers, and that usually takes a lot of time.
This year the stars were aligned. There is a significant amount of money available to implement any changes. JLARC staff have done a year’s work of analysis. They have collected reams of data, interviewed scores of local, state, and national experts in education funding, and performed numerous analyses of the data. They have built their own version of the SOQ model in order not to be dependent on the Department of Education for testing various models and approaches. They have built a model to determine how a student-based funding formula would work.
Based on the experience of prior years, significant changes in major state programs, such as how to fund K-12, need to be considered and formulated before the General Assembly session. There is simply not enough time to devote to such issues during the session. Ideally, the study and consideration would be a joint effort of the legislature and the administration.
The General Assembly knew this study was in the works. After all, legislators make up the membership of JLARC. The Governor knew, or should have known, of the impending report. JLARC staff had numerous discussions with the financial staff of the Department of Education, gathering data and working out clarifications of that data. Both the Governor and the legislature knew that there would be significant revenue balances available.
Ideally, the Governor and the legislature could have created a task force, comprised of legislators, local educators, private citizens, and members of the administration, with the task of using the findings and recommendations of JLARC as a starting point for legislation to reform the way the Commonwealth funds K-12. Alternatively, the legislature could have established a special joint committee to take on this task. Similarly, the Governor could have created such a task force. The JLARC staff has conducted the staff work needed and set out some recommendations as a starting point. If any such task force or special committee had been established in May of this year, there would have been enough time to work out legislative proposals. It is now the middle of August and there are much more important priorities looming—elections.
In the administration’s response to the JLARC report, Aimee Guidera, the Secretary of Education and Lisa Coons, the Superintendent of Public Instruction, called the current funding formula “undecipherable” and declared “the need for reforming key elements” of it. They went on to complain that “the current formula contains arbitrary and restrictive provisions” and is “antiquated.” It remains to be seen what the administration will propose to address these shortcomings.
There is one ray of hope. Dr. Coons, the Superintendent, came to Virginia from Tennessee, where she most recently served as chief academic officer for the Tennessee Department of Education. Tennessee is transitioning from a staff-based funding formula to a student-based formula. Perhaps Dr. Coons can use her experience in Tennessee to devise a student-based formula for Virginia for the Governor to include in his proposed 2024-2026 budget. The JLARC report provides her a good base.
As Chris Braunlich, recently-retired president of the Thomas Jefferson Institute for Public Policy, recently asked, “Other states have updated how schools are funded. Why can’t Virginia?”
Leave a Reply
You must be logged in to post a comment.