

by James A. Bacon
A number of University of Virginia Board of Visitors members have expressed concern about UVa’s runaway costs. Administrative bloat has swollen the university’s cost structure, they say, and higher costs have been cited in turn to justify tuition increases. So far, the fiscal hawks have been unable to force a discussion of the topic during regular board meetings. Indeed, simple requests for data on headcounts and salary costs have gone unanswered.
The refusal of UVa leadership to share the data is all the more remarkable in that the statistics are readily available. Indeed, much of it is maintained on the UVa website by the office of Institutional Research & Analytics (IR&A). The 17 members of the IR&A staff have the mission of supporting “the University community” — which, presumably, includes the Board of Visitors — in “assessment, planning, and decision-making.”
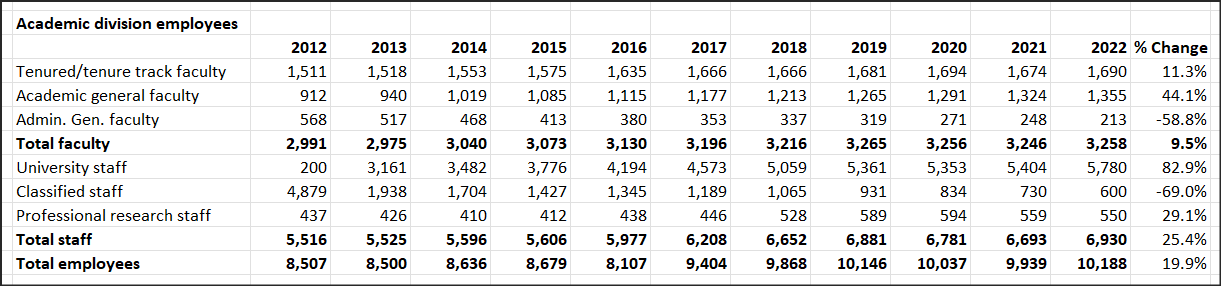
As it turns out, the IR&A data confirm the suspicions of the fiscal hawks. Between the 2011-12 academic year and the 2021-22 year, UVa’s academic division (excluding the healthcare division) saw the ranks of salaried staff grow dramatically — at twice the pace of faculty — even as enrollment barely budged.
Student enrollment (full-time-equivalent): +8.8%
Total faculty: +9.5%
Total salaried staff: +25.4%
(Student headcount comes from the State Council of Higher Education for Virginia.)
The IR&A numbers raise issues about faculty productivity as well, and we’ll get to that in a follow-up blog post. But the big story over the past decade has been the surging cost of administrative overhead.
The IR&A posts the numbers here under the umbrella of “university data.” In the following table I have summarized the count of “salaried university employees” in the “Academic Division” over the years 2011-2012 through 2021-22.
Several sub-trends are evident.
“Administrative general faculty” saw a steady decline over the decade — from 568 employees to 213 employees. These are generally lower-level employees who provide administrative assistance to the faculty, usually at the departmental level. Judging by the numbers, the university has squeezed this category relentlessly. It would make an interesting Board discussion to see if faculty members have experienced a corresponding uptick in administrative duties and if so whether the added responsibilities have impacted their productivity.
The “Classified staff” classification experienced a steady decline over the 10-year period, but it was largely offset by a corresponding increase in “University staff.” I repeatedly asked UVa for definitions of these classifications and explanations for the sub-trends but have received no response over three weeks. However, the UVa HR department defines “classified staff” as salaried, non-faculty employees hired before July 1, 2016, who elected not to participate in the University Staff HR plan. “University Staff” are those hired after July 1, 2016, who do participate. In other words, some of the number changes are the result of reclassifying employees. Still, the two categories combined show a significant increase.
One other category, professional research staff, is worth mentioning. This category consists principally of research associates, research scientists, senior scientists, and principal scientists who have limited-term appointments. Their number increased from 437 to 550 over the period, a 29% increase. This trend coincides with an increase in R&D grants at UVa and should not be equated with administrative featherbedding. The category represents a small sub-set of salaried employees, however, so it accounts for only 14% or so of the total increase in administrative employees.
The IR&A data tell us only part of the story. The university increased the number of salaried staff by 2,000 over 10 years. What do those people do? There is no way of knowing from a high-altitude look at the data.
Also, the IR&A numbers count salaried employees only. The published data do not track more than 12,000 wage-earning employees (2022 numbers). Is the number of these employees increasing or decreasing? Furthermore, the numbers tell us nothing about work outsourced to consultants and vendors. Is that practice waxing or waning?
We can conclude one thing for certain, however. There is no question that the data are readily available. The office of IR&A has it. The Ryan administration has it. The Board of Visitors should have it, too.
Correction: This article has been updated to correct an erroneous statement in the original version that student enrollment increased only 1.1% between fiscal 2012 and fiscal 2022. The correct figure is 8.8%.
Leave a Reply
You must be logged in to post a comment.