
by John Butcher
Table 15 in the 2022 Superintendent’s Annual Report includes the division expenditures per student for operations. Let’s juxtapose those data with the 2022 division Standards of Learning (SOL) pass rates. But first: Economically Disadvantaged (ED) students (those eligible for Free/Reduced Meals, receiving Temporary Assistance for Needy Families [TANF], eligible for Medicaid, or identified as either Migrant or experiencing homelessness) pass the SOLs at rates about 20 percent lower than their more affluent peers (not ED). Thus, division SOL averages are affected by the relative percentages of ED and Not ED students in the division. The (very nice) SOL database provides data for both groups so we can look directly at the divisions’ performance.
To start, here are the 2022 SOL reading pass rates graphed vs. the per student expenditures.
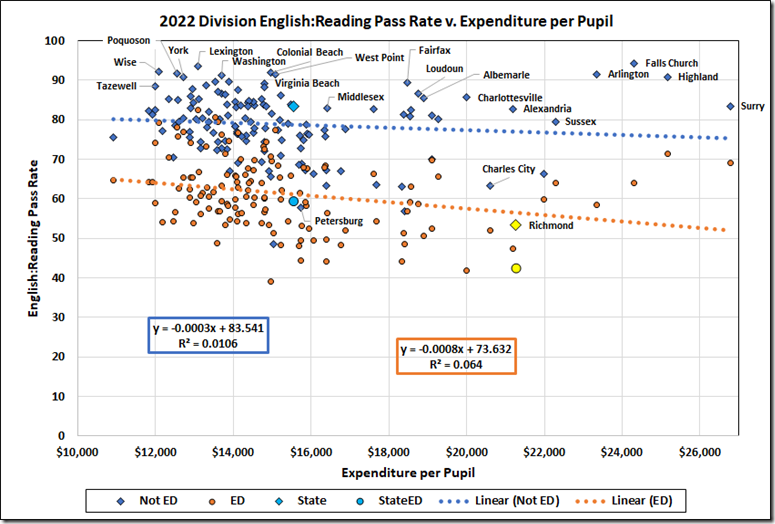
There’s no room to label that crowd of data points. I have settled for labels on some of the high performers and three not-high performers. The aqua points are the state averages. Richmond is the gold points.
As you can see, some of the high-expenditure divisions do very well while some do not. And a number of low expenditure divisions do just as well as the best high expenditure ones. Falls Church leads the pack for the Not ED rate but is just above the state average as to its ED number.
The least squares fitted lines have negative slopes that might imply an inverse relationship between pass rate and expenditure but the R-squared values (1 percent and 6 percent) tell us that those variables are only distantly correlated. In any case, it is clear that Arlington, Falls Church, Highland, and Surry are paying about twice as much per student for excellence as Wise, Poquoson, York, Lexington, and Washington.
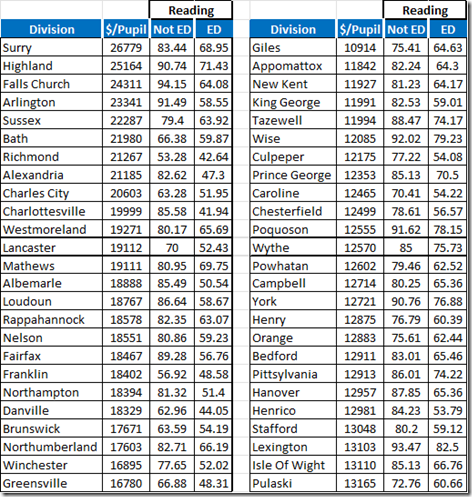
Here are the 25 big spenders and the 25 least spenders.
The math data paint a similar picture, but with four of the low cost divisions beating even Falls Church.
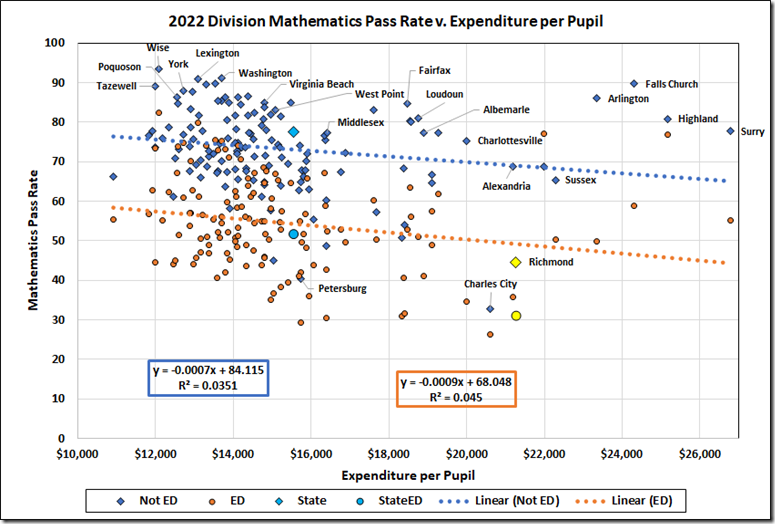
Indeed, as to ED students, those four (Wise, Washington, Lexington, and Patrick) and 39 others beat Falls Church. Here are the top 11 in each category.
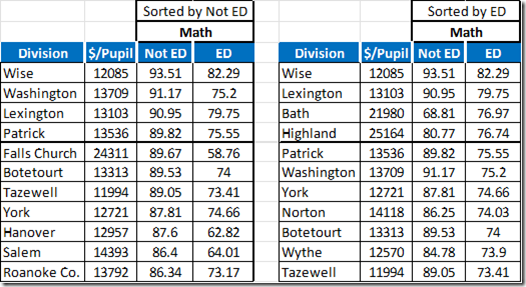
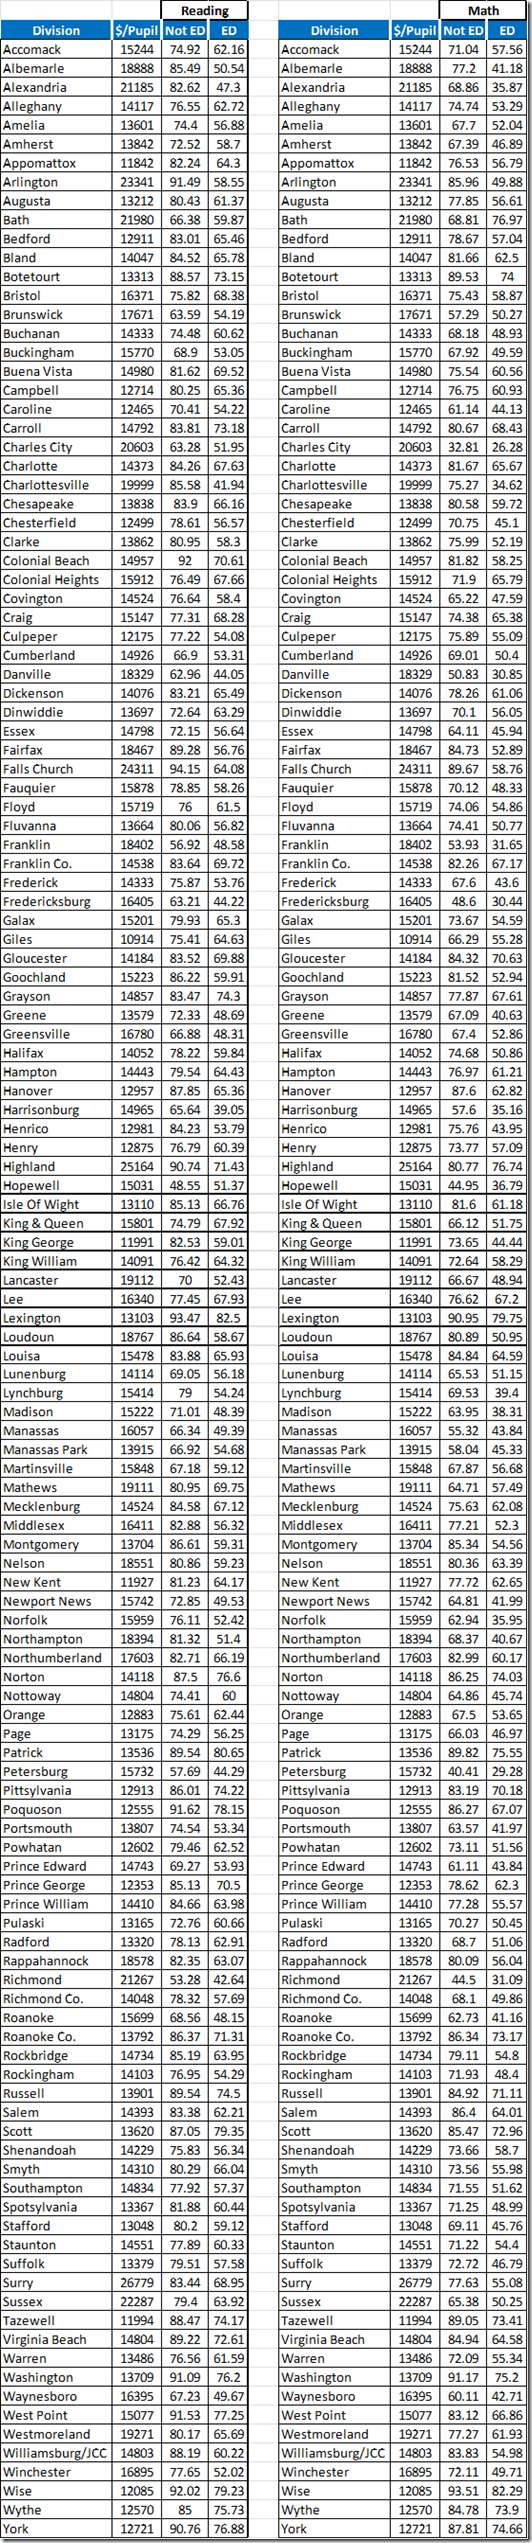
And here are the datasets for both subjects.
The next time your school board asks for more money, you might respond by asking what Wise, Tazewell, and Washington are doing that lets them perform so well at such low cost. Hint: See this.
John Butcher is a retired attorney living in the Richmond area. This column has been reprinted with permission from Cranky’s Blog.
Leave a Reply
You must be logged in to post a comment.