• China’s Very Fast Trains

    By Peter Galuszka

    (second in a series)

    SHANGHAI — ย As the soggy countryside zipped past, my eyes were fixed on the speedometer of the maglev train hurtling towards Shanghai Pudong ย International Airport. The instrument hanging over a passenger door shot up from 150 kilometer per hour, to 247 kph and finally to 300 kph or about 187 miles per hour.

    The ultra-fast, eight-year-old line got us from the city limits to the airport in all of seven minutes. It can go evenย  faster– 268 mph. And as we started to slow down during this exciting run, I thought back to Virginia and all the silly hullabaloo over getting creaky old Washington Metro to Dulles International Airport.

    The thought was a bit of a downer. At Dulles, the official international airport of the capital of what is supposed to be the most influential country in the world, you can’t even think about infrastructure improvements without a series of peanut vendor arguments from the right wing. They include whose ox gets gored to pay for Dulles rail and whether the Metropolitan Washington ย Airport Authority has (gasp!) a labor union official on its board of directors.

    Here in China, they don’t mess around with such nonsense. If they want to do something, they do it, or build it. It is a Communist country with plenty of industrial policy so they just fund it. Of course, they have the money to put into an ultra-modern rail system built by Germany’s Siemens and that is admittedly a problem in the U.S. But the Chinese, unlike Americans, are looking ahead to what’s needed and are not sticking their heads in the sands to worry about whether their grand schemes have the dogmatic imprimatur of the American Enterprise or Cato Institutes.

    The Chinese think big. To get an idea just how big,ย  consider my experience at the Beijing Capital International Airport. My wife and I checked into a hotel near the airport for an early morning flight and had some hours to kill in the center of the capital. Later that evening, we took the airport express train back to the airport and the hotel.

    Mind you, the Beijing Airport is a truly monstrous destination. Conde Nast Traveler named it the world’s best airport in 2009. But the three terminals are far from each other to accommodate the latest in airline size, notably the bulbous Airbus 380 that can hold 555 passengers.

    We got onto the airport express train for the 25 minute trip to the airport. As we pulled into Terminal 3, the most recent addition, I told my wife, “We don’t want this one, we want Terminal 2.” So, we stayed on. I had expected a brief ride. Instead, the train gained speed for two minutes, five and then eight. My wife was glowering at me, imagining this to be yet another in a long series of screw ups during our ย nearly quarter century history together. “I hope we don’t end up all the way back downtown and have to come out again,” she exclaimed, her eyes narrowing. Imagine my relief when the announcer said, “Terminal 2 next.”

    Big, indeed. If these project and the litmus test for the future, then Americans are truly going to be left behind if they buy into the short-sighted, skinflint philosophies that have been popular ever since Barack Obama was inaugurated.
  • Is Congestion Really Getting Worse? Maybe Not.

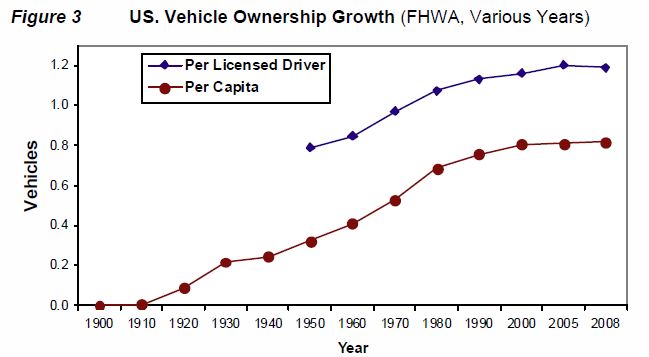
    Click on graph for more legible image.

    A couple of weeks back I reviewed the 2011 Urban Mobility Report (see post), findingย  credence in its measures of traffic congestion but seeing little value in its public policy solutions. My criticism were mild compared to the scathing critique by Todd Litman, head of the Victoria Transportation Policy Institute, who found the study worse than useless. You can read his withering attack here.

    One argument that intrigued me was his contention that congestion has not been intensifying over the past several years, as the Urban Mobility report suggests. If anything, people are driving less and congestion is easing. Writes Litman: “U.S. vehicle travel peaked in 2003, and contrary to the UMRโ€™s assumptions, there is no evidence that total vehicle travel will grow significantly in the future, due to demographic and economic trends that are reducing per capita vehicle travel in the U.S. and other developed countries.”

    In a recent report, “The Future Isn’t What It Used to Be,” Litman shows how key trends that drove the increase in Vehicle Miles Driven are leveling off. Look at the chart at the top of this post, which shows the growth in U.S. vehicle ownership. The numbers started leveling off before the 2007 recession. That’s because among affluent and middle-class Americans, nearly every person with a driver’s license now has his or her own car. A steady increase in the number of drivers had propelled Vehicle Miles Traveled for decades. Now that everyone has a car, that impetus has lost its momentum. (There may be a pent-up demand for automobiles among lower-income Americans but tighter credit conditions and wage stagnation makes it difficult for them to join the ranks of auto owners.)

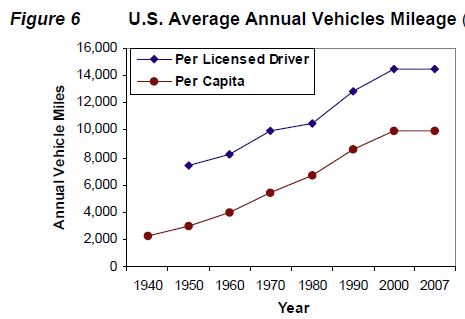
    Click on chart for more legible image.

    Further, Litman points out that as aging Baby Boomers reach retirement, they will drive less. Factor in the end of cheap fuel prices, a residential real estate crash that hit hardest in exurbia where people drive greater distances, the continued migration to metro areas from rural counties where people also tend to drive longer distances, the increasing disinclination of young people to buy cars, the rise of telework and a number of other reasons, it’s no wonder that Americans are driving less. Indeed, about the only major factor pushing VMT numbers up is a growing population.

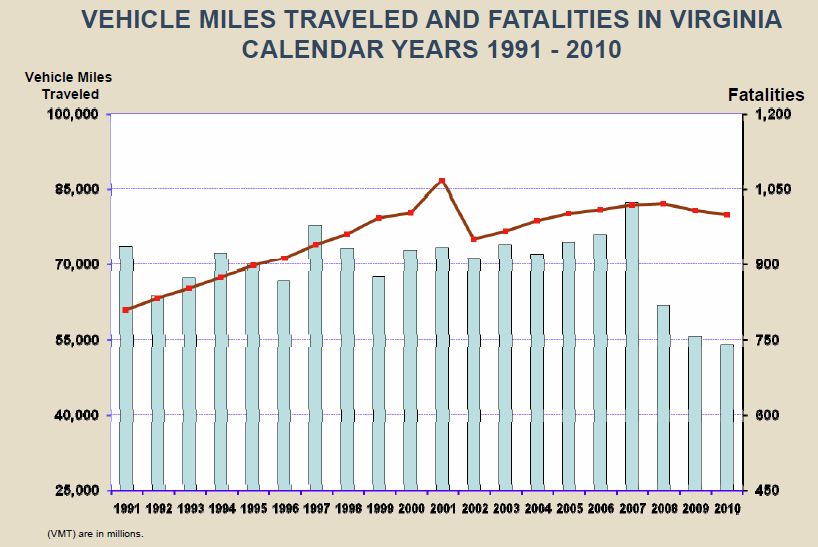
    Virginia VMT. Source: Division of Motor Vehicles

    Of course composite numbers at the national level can obscure a lot of cross-cutting trends. The decline in VMT has been less pronounced in Virginia, not surprising given the faster-than-average population growth and stronger-than-average economy here.ย  Even so, after peaking in 2008, VMT dipped in 2009 and 2010. It would be really interesting to view the numbers by transportation district or, even better, by metropolitan area. I would expect to see that VMT remained strong in Northern Virginia but that the Rest of Virginia tracked the rest of the country. If that conjecture is correct, it would call into question the need to sustain a large road/highway construction program anywhere outside Northern Virginia. And even in NoVa, one could argue,ย  new construction there would best be channeled into projects like retrofitting Tysons Corner transportation system than blazing new paths through undeveloped countryside.

    At the very least Litman’s argument calls into question the extrapolation of past trends indefinitely into the future. The public policy apparatus of Virginia is operating on the premise that VMT will continue growing at historical rates. But if that premise is unfounded, so may be the justification for many of the transportation projects on the books.


  • Too Bad We’re Not Dead Last

    Public officialdom in Virginia has been increasingly focused on Virginia’s heavy dependence upon the federal government for economic activity and employment. As the Joint Legislative Audit and Review Commission pointed out in its “Review of State Spending: 2011 Update,” Virginia ranked second among the states in total federal spending per capita.

    In federal FY 2009 the federal government spent $155.6 billion in Virginia (up from $118.5 billion the previous year). “The largest share of federal spending in Virginia ($82 billion or 47%),ย  states the report, “was for procurement of goods and services, including services provided by federal contractors based in Virginia. When federal spending starts declining, as inevitably it will, there goes the ol’ economic base.

    If there’s a silver lining, it’s that Virginia’s state budget is less dependent upon federal grants. States the JLARC report: “Since federal FY 1995, Virginia has ranked between 47th and 50th among the states in terms of per capita receipt of federal grant awards. In FY 2009, Virginia ranked 49th.”

    Forty-ninth is pretty good, although I say we should aim for dead last.

    — JAB


  • The Wonk Salon, October 12, 2011

    State Spending Still Outpacing Inflation, Population Growth
    Joint Legislative Audit and Review Commission
    Despite the recession, state spending over the past 10 years has outpaced inflation and population growth by a wide margin. General Fund spending hasn’t kept up — the growth comes from Non-General Fund spending.

    Medicaid Errors Costs the State $ Tens of Millions
    Joint Legislative Audit and Review Commission
    Improper eligibility determinations may have cost Virginia’s Medicaid program between $18 million to $263 million in FY 2009. Outright fraud cost only $6.1 million.

    Rural Telecommunications Creates Jobs
    Manhattan Institute
    Rural telecommunications operations have a direct economic impact in Virginia of $241 million and an indirect impact of $118 million.

    Housing Voucher Recipients Go Suburban
    Brookings Institution
    When people get housing vouchers, where do they choose to live? Surprise, surprise, half of them choose to live in the suburbs.

    Rethinking Teacher Retirement
    American Enterprise Institute
    Schools recruit 300,000 teachers a year — about one in five new college graduates. No wonder it’s hard finding qualified teachers. How about hiring more older, mature second-career teachers?


  • The Old Boy’s Still Around

    By Peter Galuszka

    (first of a series)

    BEIJING, China — Red and gold emblems flap around Tiananmen Square in celebration of 62 years of the People’s Republic of China. This holiday, the sprawling square area is thronged with Chinese families of all ages on this warm and sunny fall afternoon.

    I am here on a book research trip that will take me into three Asian nations. Of the three, China holds the spotlight as the coming thing. It’s been the coming thing since the 1980s when Deng Xiaoping turned more than three decades of Maoist central planning on its head and started market reforms. A combination ofย  pent-up entrepreneurial zeal that’s part of the Chinese DNA and a huge, young population soon sparked double-digit GDP growth rates that started to slow from 11.9 percent in 2010 to 9.7 percent only this year.

    The results are stunning. The capital boasts of new buildings, clean streets, an efficient subway system, and luxury stores andย restaurants. Growth is concentrated in coastal areas, such as Guangzhou and Shanghai where I stopped first to pick up my wife who is spending the year teaching there. Conventional wisdom has it that with its wealth and growth levels, China is fast eclipsing the United States as the world’s leading power — a view that my otherwise pleasant French Canadian seat mate mentioned as many as five times on the flight over from the states.

    Shanghai is likewise a shiny jewel of Chinese modernity, shinier even than Beijing. Its riverfront skyscrapers soar high. Everywhere, gigantic flat screen televisions and LED lights flash out new light architecture. One example of this almost obscene longing for western-style commercialism is Wu Jiao Chang, a square that just got a new subway stop last year. At least four huge, multi-level shopping malls surround the square. Its focal point is a passenger rail line running through the center that has cladding shaped like a giant dirigible covered by thousands of tiny, color-coordinated flashing LED lights.

    “People in Shanghai don’t seem to want anything more than eat, shop and have their hair done,” my wife says. Her words echo those of French philosopher Jean Paul-Sartre who once said: “Hell is all the people at a Shanghai department store at the same time.”

    The mass-overconsumption so complained about on this blog is in full throttle in China’s big cities. Does it mean true modernity and western values? Not at all.

    For an example, let’s go back to Beijing. We stayed at a no-star Chinese hotel near the massive airport because we had an earlier morning flight and couldn’t handle morning traffic. It wasn’t anything we couldn’t handle after years in the former Soviet Union, but it was tucked away in what you might think of as the real China. Garbage lay on the steps of the little eateries and hair dressers in a little strip mall that seemed destined soon for bulldozers. I needed the Internet to get in touch with Expedia.

    I ended up in an “Internet cafe” up the dirty stairs of a building. The room was filled with 60 or more terminals with young Chinese playing Net games at some. But you don’t just sit down and boot up. You have to go to the bar where a man examines your passport and writes down all pertinent information for the police. The Net is tightly restricted since the Communist government fears the kind of Twitter-based backlash that this year brought down regimes in Egypt and Tunisia and probably Libya.

    I sat down at an ancient Acer desktop with a keyboard that has been through several iterations of rebuilding. The keys are alternately black and red. It’s slow and pokey. A scary thought goes through my head: Do I want to put my Expedia personal data on this? Hell no.

    I remember a Wall Street Journal story from earlier this year reporting that Chinese governments officials allegedly hacked hundreds of Google email accounts. The hacking was tracked to the People Liberation Army’s technical reconnaissance bureaus in the city of Jinan. This Big Brother approach is reminder of just how much China hasn’t changed, despite the glittering lights.


  • Virginia’s Skewed Prosperity

    by James A. Bacon

    In its latest study, “Unbalanced, Unequal and Undercut: The State of Working Virginia,” the Commonwealth Institute (CI) has picked a timely topic,ย  conducted some excellent research, displayed some fascinating Virginia-specific data…. and created a terribly misleading impression.

    The center-left think tank reports that wages in Virginia have rebounded from the recession more robustly than in other states. Median individual wages increased to $17.83 an hour in 2010, roughly 11% above the national average and the 8th highest of any state. Moreover, since the start of the downturn in 2007, median wages have increased by about 5% in real terms — the fourth highest increase in the nation.

    The good news… Virginia wages are rising faster

    Why has Virginia out-performed the nation? That might make interesting reading. But CI chooses to pursue a different story line: how the gap between high- and low-wage workers in the Old Dominion is wide and getting wider. In 2010, the top 10% of wage earners in Virginia earned about 5.7 times the wages of the bottom 10% — the widest gap of any state, save New Jersey.

    The bad news… Income gains are going to the highest paid workers

    Moreover, while wages may be picking up in the current business cycle, almost all the gains are going to people with more education and in higher-paying industries. “Between 1980 and 2010, the real wages of the top 10 percent of workers in Virginia increased by more than 52 percent,” write the authors. “Median wages, on the other hand, grew by just over half that much (27 percent) โ€” and wages for the bottom 10 percent of workers increased by just fiveย  percent.”

    Clearly, when viewed as a statewide phenomenon, the wage gap is alive and well in Virginia. But what does it all mean? Here’s what CI says:

    The nature of these imbalances represent major setbacks for large segments of working Virginia, creating significant and growing distance between poverty and prosperity in the state. While it is encouraging that Virginia is adding more high-wage jobs, the high concentration of job losses in mid-wage industries since the start of the recession presents real challenges for Virginiaโ€™s middle class workers and should inform the discussion around what policies to implement in order to expand this critical segment of Virginiaโ€™s economy.

    Maybe, maybe not. As CI also notes, average weekly wages vary widely across Virginia — from aย  high of $1,264 in Northern Virginia to a low of $611 in Danville. Moreover, wages have been recovering significantly faster in Northern Virginia than in the rest of the state (excepting only the Winchester and Bristol metropolitan statistical areas). As CI concedes, Northern Virginia with its huge and wealthy population “distorts” the statewide average weekly wage.

    I would put it differently: It is silly to look at Virginia as a single, unified labor market and bemoan the income disparities within it. A huge amount of the statewide disparity — and the increase in that disparity — can be attributed to different regional income dynamics. Northern Virginia is one of the highest-income regions of the entire country. No other Virginia region comes close. At the same time, Northern Virginia is also the most expensive region in Virginia in which to live. Adjusted for cost of living, the disparity in living standard between NoVa and Danville is significantly less than two to one. But CI’s metrics don’t account for cost of living.

    CI could have emphasized a very different narrative: Northern Virginia, where incomes (and the cost of living) is highest, is creating more jobs than other regions of the state. Because these jobs tend to require higher levels of education and more demanding technical skills, they pay more. As a result, the growing statewide disparity in incomes is to some considerable degree explained by Northern Virginia’s success, not a growing disparity within regions. Is Northern Virginia’s triumph a bad thing for downstate Virginians? It’s not as if the region’s prosperity comes at the Rest of Virginia’s expense. In fact, NoVa contributes disproportionately to the cost of running state government. RoVa residents have every reason to be thankful.

    The Commonwealth Institute study is well worth perusing. It contains loads of data useful for understanding the wealth gap in Virginia, such as it is. Just don’t get sucked into its woe-is-me worldview.


  • Restructuring the Gas Tax

    by James A. Bacon

    Virginia’s 17.5-cent tax on motor fuels is like an over-the-hill ball player. Back in 1986, when the rate was last set, the tax could run, leap and throw like a champ. These days, it wheezes just walking around the block.

    With each passing year, the gas tax is less able to fulfill its task of paying for the maintenance and construction of Virginia’s roads and highways. Within five years, Transportation Secretary Sean Connaughton has warned, there won’t be enough gas tax revenue to pay for new construction. Beyond that five-year time frame, one can only presume, gas tax revenues won’t even cover proper maintenance. As maintenance is deferred, the deterioration of roads, bridges and highways will accelerate, requiring even more money to fix. Unless something changes, Virginia’s highway infrastructure will slip into a death spiral.

    The obvious solution is to raise the motor fuels tax. Trouble is, the tax is widely loathed. Voters perceive, with some justification, their tax dollars funding mega projects that benefit developers, ideologically driven money-losers like mass transit, or roads to nowhere that please powerful politicos. Until that distrust is dispelled, it will be exceedingly difficult to persuade the electorate to increase the tax.

    What I propose here is far from a complete transportation financing solutionย  but it would accomplish two things. First, it would fully fund Virginia’s road maintenance program far into the future, which the current arrangement will not. Second, it could be sold to the public. My proposal would not raise revenue for new construction — that would have to come from somewhere else. But citizens would be assured that the state’s massive investment in streets, roads and highways would be kept in top condition.

    As I see it, the motor fuels would be adjusted annually to ensure enough revenue to accomplish three goals: (1) service state transportation debt, (2) provide state matching funds for federal highway projects and (3) fully fund the maintenance of state and local roads and highways. If more money is needed to accomplish those three goals, the tax ticks up; if less is needed, the tax inches back down. That’s it. When citizens gas up their cars at the pump, they will know that their gas tax is paying to maintain the roads they drive on — not to enrich some politicians’ developer buddy — and that they are paying in proportion to which they add wear and tear to the system.

    I can’t imagine how this would get push back from taxpayers. No one contests the need to meet the state’s debt obligations. Very few would dispute the desirability of raising enough money to qualify for hundreds of millions of dollars yearly in federal highway grants (for which Virginians have already paid through the federal motor fuels tax). And not even the most hardened taxaphobes could object to maintaining the existing transportation network by means of a user fee like the gas tax.

    As an aside, I would suggest re-balancing the share paid by heavy trucks and ordinary motorists. Every analysis I have seen suggests that heavy trucks in Virginia pay less than it takes to offset the disproportionate pounding they dish out to state roads. If trucks paid their full freight, so to speak, automobile drivers would pay a slightly smaller share and might, until maintenance costs inevitably marched higher, enjoy a momentary reduction in the tax rate.

    The floating gas tax would accomplish one other important goal: finance the devolution of secondary road maintenance to the counties. Nearly everyone agrees that secondary roads should be the responsibility of local governments to build and maintain. Why? Because county supervisors make land use decisions that create the demand for those roads. If local officials think that paying for those roads is VDOT’s problem, not theirs, they will make very different decisions than if they are held accountable for dealing with traffic congestion themselves. Pushing counties into coordinating land use and transportation will lead to better decision making for each.

    The state has offered county governments the opportunity to take control of their own road maintenance but none have agreed (other than Arlington and Henrico Counties, which opted out of the current system back in the 1930s). The reason is basic: Counties don’t think that VDOT will pay the full cost of ongoing road maintenance, much less enough to work down the backlog of roads and bridges in disrepair. Therefore, the gas tax would have to be set at a level sufficient to induce counties to assume responsibility for their secondary roads.

    How, then, would Virginia pay for new transportation projects? There still would be buckets of bucks to draw upon: federal transportation dollars, tolls, public-private partnerships, proffers, impact fees and special tax districts, not to revenue streams from the sales tax, the motor vehicle sales tax, motor vehicle registration fees and miscellaneous sources.

    Floating the motor fuels tax as I have suggested won’t create more money for new construction. But given the mood of the electorate, positioning the tax as a user fee may be the only way to persuade taxpayers to inject more money into the system. In the years ahead, it will be no small accomplishment to preserve what we’ve already got.


  • Making the GOP Case for a Gas Tax Increase

    Michael S. Bronzini

    by James A. Bacon

    For years, Republican politicians in Virginia have held firm in their opposition to higher taxes, even if those taxes, like the levy onย  motor fuels, can be construed as user fees. But the ground seems to be shifting.ย  A study published September and underwritten by former Gov. Jim Gilmore’s Free Congress Foundation stops just short of endorsing an increase in taxes/user fees to upgrade the nation’s surface transportation system. This comes at a time that the McDonnell administration says it is โ€œconsidering seeking additional revenue sources” to maintain state roads and highways.”

    In his paper, “Surface Transportation: The Case for Growth,” Michael S. Bronzini, an engineering professor at George Mason University, argues that investments in surface transportation promote economic output and productivity, that public investment has been lagging needs for several decades, and that the private sector is unable on its own to meet the need for regionally and nationally interconnected networks of transportation services.

    “While some gains can be made through better use of existing revenue, rehabilitating the existing system and investing in our future will require spending that is tens of $billions per year above recent levels,” Bronzini writes. “It may be time to recognize that investing in surface transportation is one of the most productive uses of tax revenue, hence citizens should expect their legislators to accord this high priority.”

    Bronzini cites a number of sources to make the case that investments in roads, highways, transit, railroads and maritime systems have a “provable link” to economic development. Most notably, transportation infrastructure lowers production costs, permitting more output and a higher GDP than otherwise would occur.ย  Investment in non-local roads between 1950 and 1980 yielded annual cost savings to industry of 24 cents for each dollar of investment. The rates of return were significantly higher than returns to private capital and the long-term interest rate.

    (Bronzini cites a Rand Corporation study in support of this argument, but he mentions only in passing Rand’s conclusion that the returns have been declining steadily over time and have reached a point by 1980 at which point it is was debatable whether additional investment in road and highway represented a net social gain or loss.)

    Bronzini points to a February study by Stephen S. Fuller, also of George Mason, that calculated the economic impact of constructing 16 proposed mega projects as public-private partnerships backed by tolls. The projects, ranging from the Third Crossing in Hampton Roads to the Coalfields Expressway, would cost a total of $30 billion but create a $4 billion gain to State Domestic Product, including 57,000 jobs and $2.9 billion in personal earnings. Two years’ of added economic growth attributable to the mega projects would equal the state’s financial contribution.

    In making the caseย  for higher levels of government investment (he can’t bring himself to say higher taxes), Bronzini argues that real (inflation-adjusted) highway spending per mile has fallen by 50% since the federal Highway Trust Fund was established in the late 1950s, that the number of miles traveled by automobiles and trucks has roughly doubled, and that half the lane-miles on federally funded roads are in various stages of decrepitude. “An ever-expanding backlog of investment needs is the price of our failure to maintain funding levels — and the cost of these investments grows as we delay.”

    Bronzini discusses the motor fuels tax, which can be construed as a “user fee” on the grounds that “the more you drive, the more you pay.” Increasing the tax is one way to deal with the funding shortfall, he suggests.ย  An increase in the fuel tax of 10 cents per gallon would amount to $5 per month per vehicle, or $9 per month per households. He warns, however, that the motor fuels tax are not a stable, long-term funding source as cars get more miles to the gallon, and that an alternative such as a Vehicle Miles Traveled fee may have to be considered.

    Two things are missing from Bronzini’s analysis. First is the recognition that not all projects are created equal. Some provide a better return on investment than others. He avoids drawing the obvious conclusion that there needs to be a mechanism for separating economically viable projects from the boondoggles Secondly, he shuns any discussion of human settlement patterns. The economic payback of transportation improvements is inseparably tied to the balance, or lack of it, of land uses served by the improvements as well as the density and connectivity of development. A case can be made that the motor fuels tax should be raised to a level that can pay for properly maintaining existing infrastructure. But at present, no sound methodology exists for determining where funds for new construction can be most effectively deployed. Until we develop that methodology, the discussion of how much money we need to raise in taxes and user fees is getting the carriage before the horse.


  • A Pivot Point in China-American Trade… and What It Means to Virginia

    U.S. 460 at dawn

    Here is a whisper of good news for anyone who is worried by the hollowing out of America’s manufacturing economy: The mass migration of industrial production from the United States to China seems to be slowing. Indeed, some jobs are trickling back home.

    In a Saturday article, the Wall Street Journal highlighted the opening of a furniture factory in Lincolnton, N.C., a rare event for an industry that been devastated by outsourcing. Furniture made in China and sold in the U.S. once had a 50% price advantage. But soaring Chinese wages and higher shipping costs have scrambled the economic calculus. Bruce Cochrane, whose family made furniture for five generations before abandoning manufacturing in 1996, sees a pivot point in the economics of outsourcing. He figures he can compete in the U.S. by using state-of-the-art saws, routers and other machinery that will nearly double the productivity of his American workers.

    The Boston Consulting Group has identified seven industries where some production geared to the U.S. market is likely to shift back to the United States: transportation goods, computers and electronics, fabricated metals, machinery, plastics and rubber, appliances and furniture. The strengthening of the yuan and pressure from retailers for shorter turnaround times and smaller inventories are other reasons cited for abandoning the long supply chain to China.

    This comes as good news for the estimated 3.8 million Americans (800,000 in manufacturing and 3 million in service-sector support) who could find jobs as a result. Hopefully, some of those jobs will pop up here in Virginia. But it should give pause to public policy mavens in the Old Dominion who propose to invest hundreds of millions of dollars on highway infrastructure predicated on the assumption that the decades-long boom in container traffic from the Far East will continue unabated. I refer specifically to the construction of a new U.S. 460 between Petersburg and Suffolk in a public-private partnership seeded with state funds.

    Transportation Secretary Sean Connaughton anticipates a surge in truck traffic out of Hampton Roads when the completion of the Panama Canal widening in three years allows giant post-Panamax vessels to sail directly from China to the East Coast, bypassing the West Coast ports. As it happens, the opening of the upgraded Panama Canal overlaps the Boston Consulting Group’s time frame for the tipping of competitive manufacturing advantage from China back to the U.S. (See “The Panama Canal, U.S. 460 and the Public Fisc.”)

    How will these cross-cutting economic currents affect Hampton Roads? I don’t pretend to know. Connaughton may prove to be prescient in his expectation that container traffic out of Norfolk and Portsmouth will surge. But the fact is, nobody knows for sure.

    The question then arises, how much risk is the state willing to assume in the funding of the U.S. 460 project, the cost of which could run as high as $2 billion? It is clear that tolls alone will not cover the cost of building the 55-mile, limited-access highway. The Virginia Department of Transportation has committed to a $500 million subsidy to design and build the project.

    If the private consortia bidding on the project believed so much in the market opportunity that they were willing to invest their own capital, then the McDonnell administration should move heaven and earth to help make the project happen. But that’s not the case. Private investors are not willing to assume that risk. That worries me. Further, I see no sign that any third party, whether a newspaper or citizens group, is giving the project the outside scrutiny that it warrants. That worries me, too.

    — JAB


  • Does More Education Really Equal Greater Economic Output?

    by James A. Bacon

    Identify the person who said this quote: “In Virginia, one of the key goals of Governor Bob McDonnellโ€™s Top Jobs higher education legislation is to increase the number of degrees earned by Virginians by 100,000 over the next 15 years. Why? Because more education equals greater economic output and better quality of life for all citizens.”

    That statement could have come from any of hundreds of members of Virginia’s political class, for it reflects a near-universal consensus. The blind faith in “more education” regardless of circumstances is common to Democrats, Republicans, Greens and just about everyone other than a few hard-nosed cynics of a libertarian bent… like myself. This particular quote came from Teresa A. Sullivan, president of the University of Virginia, writing in the current edition of the Virginia News Letter (which just happens to be a UVa publication).

    In “Higher Education as an Engine of the American Economy,” Sullivan makes a number of points that are worth keeping top of mind as Virginians think about how to prosper in a globally competitive knowledge economy. Universities educate the next generation of citizens. They are centers of R&D. They are magnets for the creative class. They are important players in the ecosystem of business and technological innovation. In sum, it’s difficult to imagine any state or metropolitan region prosper in the absence of strong, vibrant universities. Writes Sullivan:

    “Perhaps more than ever, we need our universities to function well and to receive adequate support because universities are uniquely well suited to tackle the big, complex problems we are facing as a society such as climate change, disease control, economic turmoil, and other multi-faceted problems. University researchers and scholars are able to work across disciplines and to draw connections between their areas of expertise to arrive at solutions for these complex problems. Universities are built around a spirit of collaboration that todayโ€™s problems demand.”

    All very true. But as the national economy hurtles toward Boomergeddon, threatening to drag Virginia with it, we no longer have the luxury of writing anyone a blank check based on bromides and generalities. Yes, we need to support our colleges and universities. But, no, we don’tย  blindly accept the proposition that “more education equals greater economic output and better quality of life for all citizens.”

    In a utopian world, everyone who wants to go to college could do so. But we live in the real world, a world in which millions of Americans are raised in a culture of poverty that does not venerate learning. We live in a world in which children are subjected to an educational system so dysfunctional that they longer they are exposed to it, the worse they perform in international tests. We live in a world in which a significant percentage of college students are intellectually too ill equipped to gain any benefit from their courses. Given the ubiquity of remedial classes and a disgracefully high college drop-out rate, it appears that we have already shot way past the optimal enrollment in our universities already.

    Should we really be enrolling 100,000 more students in Virginia universities? I suspect not. Instead of pouring more money into universities on the vacuousย  grounds that “more education equals more economic output,” we should be investing resources — or, better yet, restructuring our K-12 educational institutions — so they properly prepare more young people for the rigors of college before they go to college. It’s hard for university presidents to turn down more money from state government. But citizen-taxpayers should demand a higher order of critical analysis.


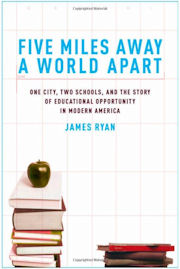
  • Five Miles Away, a World Apart

    University of Virginia Law Professor James Ryan is attracting a lot of attention with his new book, “Five Miles Away, a World Apart,” which looks at the issue of school desegregation through the prism of two schools divided by a municipal boundary: predominantly white Douglas Southall Freeman High School in Henrico County and predominantly black Thomas Jefferson (Tee Jay) High School in the City of Richmond. โ€œThe line that separates Tee-Jay and Freeman,” he writes, “represents the most important boundary in public education: the boundary between city and suburban schools.โ€

    A former law clerk for Supreme Court Justice William Rehnquist, Ryan is not easily pigeonholed ideologically. He is deeply concerned about the inequities created by unequal educational opportunity, believes in an integrated society…ย  and supports vouchers as a means of empowering parents with school choice. He concludes that a lack of money is not what ails inner-city schools — they often are better funded. What low-income students need is to rub elbows with their more affluent peers on the theory that they will absorb the middle-class ethos of higher expectations, parental involvement and harder academic application that leads to educational achievement.

    Richard Kahlenburg, a senior fellow with the Century Foundation, writes a mostly positive review for the New Republic. Amy L. Wax, a University of Pennsylvania law professor, writes a mostly critical review for the Hoover Institution. I haven’t read the book so I can’t comment upon it.ย  Although the book was written for a national audience, I live in the Freeman school district. I also suffer from the historical amnesia — how, exactly, did things get this way? — that most afflicts most Richmonders. Hopefully, I’ll get around to reporting back on this book.

    — JAB


  • The Wonk Salon, October 8, 2011

    Open Source IT Architecture in Houston
    James A. Baker Institute
    It’s time for Houston to move from expensive, proprietary IT platforms an open source architecture. Among other initiatives, the city should develop a wiki platform to capture institutional knowledge.

    Uh, Oh, Our Water Infrastructure Is Decaying, Too
    Economic Policy Institute
    Rebuilding America’s decaying water/waste water infrastructure would cost $188 billion but it could create 1.9 million jobs and be incredibly cool. Green roofs, permeable pavements and bioswales, anyone?

    Minority College Instructors Improve Minority Student Performance
    National Bureau of Economic Research
    Minority students in community colleges perform better when taught by instructors of similar race. Better roll models… decreased threat of “stereotype threats”…


  • Leveraging Dollars with Data

    A data warehousing project coming online in late 2012 will help Virginia lawmakers forge education policy based upon hard data instead of anecdote and ideology.

    By ย James A. Bacon

    Tod Massa is big man with big ideas. His goal is to build a โ€œLongitudinal Data System” (LDS) that will track the progress of Virginians from pre- Kindergarten through high school, into college and then through their working lives. With a bear-like frame and a broad, bearded face, he speaks passionately about the potential of the $17.5 million project to โ€œfundamentally transformโ€ education and workforce-development policy in the Old Dominion.

    When crafting policy, law makers rely upon anecdote and hunch, ideology and politics, and patchy, often-inconclusive research. The state has lots of data but it resides in different silos so itโ€™s of limited use. The Department of Education (DOE) maintains data on K-12 students such as enrollment, graduation rates and test scores. The State Council for Higher Education in Virginia (SCHEV) keeps track of college enrollments, degrees earned and financial aid. The Virginia Employment Commission has access to employment and wage/salary data. But none of the silos connect.

    The DOE can’t tell, for instance, how many graduates of a particular high school went on to earn a college degree, much less how much they earned when they entered the workforce. By December 2012, however, the LDS will link the separate databases, allowing analysts to get definitive answers to that type of question. If it can dispel the uncertainty that fogs so much debate over education and workforce development, a modest investment in data warehousing will pay for itself hundreds of times over.

    โ€œItโ€™s an exciting time in higher education and state government,โ€ says Massa. Virginia, like other states, has been engaging too long in โ€œdrive-by school improvements,โ€ he says, spending vast sums of money to little effect. Soon it will be possible to answer many questions not with a survey, not with a sample, but with hard data on what is. Pet theories from all across the ideological spectrum will bite the dust and a more effective educational system will emerge.

    As director of policy research and data warehousing for SCHEV, Massa represents one of three key agencies that are collaborating on the project. Virginia, he says, is one of 20 states participating in a federal initiative funded under the American Recovery and Reinvestment Act (widely known as the โ€œstimulusโ€ bill). What will be distinctive about Virginiaโ€™s linked databases is a mechanism for โ€œde-identifyingโ€ individual identities in the database. Names, social security numbers and other tags will be stripped out and replaced with numerical codes. In the Old Dominion, he insists, it will be โ€œclose to impossibleโ€ for anyone’s privacy to be violated.

    A top priority in educational policy right now is to measure how effectively teachers, principals and schools educate students. Virginiaโ€™s LDS will allow analysts to track, among many other things, how well a teacherโ€™s students perform in standardized test scores. That kind of study has been accomplished on a small scale before, but Virginia will be able to roll it out statewide. Such data can be used, with appropriate adjustments for those who teach more challenging students, as the basis for rewarding good teachers and weeding out bad ones.

    The list of questions is endless. Whatโ€™s the payoff from investing in universal pre-K? Are college grads earning enough to pay back their student loans? Are certain majors valued more highly in the workplace?

    Peter Blake, interim SCHEV director, gives another hypothetical example: Should the state channel its financial support for higher ed into undergraduate programs or should it support graduate schools, even though they cater extensively to out-of-state residents? One way to approach that question is to find out how many graduate students at Virginia colleges and universities end up getting employed in Virginia and how much money they earn. It might be easier to justify state support, he says, if it can be shown that grad schools contribute to the build-up of Virginiaโ€™s human capital.

    Massa envisions researchers rummaging through the data and looking for patterns and outliers. For example, only 30% to 50% of the students attending Virginia community colleges complete a degree (with an in-state institution) within 10 years. But the figure for Richard Bland College, a two-year college in Petersburg, is 77%. Why is that? Is there something unique about the student population, or is the college doing something different? Perhaps other community colleges can learn from its example.

    What really gets Massa stoked is the idea of letting scholars and members of the public use the data to generate their own findings. Qualified researchers will be given access to all the data under contract and, he hopes, a broad selection of the data will be made accessible to anyone with a Web browser.ย  He sees citizens being able to build their own data dashboards, create reports and publicize their findings. โ€œI want the data shared,โ€ he declares. Ninety percent of the citizen analysis may be worthless โ€“ but 10% might be spun into public-policy gold.


  • The Demographics of College Athletics

    I was poking around the National College Athletic Association website looking for a university-by-university breakdown on how much money college athletics lose. I never could find that but I did stumble across a report on ethnicity and college sports. Click here (and scroll to page 12) to view a breakdown of participation in 30 college sports by ethnicity. It’s a fascinating sociological profile.

    In the spirit of healing racial divides, let me point out that black and white Americans have more in common than they realize: They’re much bigger fans of football and basketball than Hispanics, Asians or American Indians. Indeed, blacks and whites are far more likely to participate in college athletics than other ethnicities. (This may or may not be a good thing when it comes to academic achievement, but that’s another issue.)

    Which sports are most closely identified with a particular race, in that the ethnicity is over-represented in that sport? I’m glad you asked.

    The whitest sports are skiing (90.9% of male student-athletes are white), lacrosse (90.2%) and golf (87.1%). The skiing thing makes sense, given the sport’s Nordic origins. But lacrosse? Hey, the Iroquois invented the sport, and American-Indians account for only 0.3% of male college lacrosse players. Maybe it ‘s because lacrosse has become identified with preppies.

    The blackest sports are basketball (37.8% of male basketball players are black), football (28.1%) and outdoor track (20.2%). The two college sports where you wont’ see any black men…. badminton and equestrian.

    The most Hispanic of sports is NOT baseball (only 4.1% of male college baseball players are Hispanic). Nope. The big sports for Hispanic men in college athletics are volleyball (14.4%), water polo (5.8%) and soccer (5.5%).

    How about Asians? Their big sport is… fencing (7.9%)! Not a surprise, actually, if you consider the long tradition in Chinese and Japanese cultures of the sword-fighting martial arts. Then comes gymnastics (6.1%) and tennis (4.1%).

    As for American-Indians, let’s just say that Jim Thorpe was an outlier. American-Indians aren’t much of a factor in college athletics. For males, the biggest sport is water polo, where they account for 0.7% of student athletes.

    (Note: Female participation rates tracks male participation in most sports fairly closely.)

    — JAB

    P.S. In case you wondered about sports profitability, in 2010, Division I college sports generated only 74.1% of the revenue needed to support their programs. The rest came from student fees and institutional support. For the typical (median) school, men’s football generated a profit of $3.1 million, men’s basketball made $790,000 in profit and everything else lost money. If I ever find the numbers for Virginia institutions, I will publish them.


  • The Wonk Salon, October 7, 2011

    Refining the Role of Charter Education in America
    Center for American Progress
    There are 5,000 charter schools in the United States but waiting lists indicate a demand for more. Congress should encourage the states to open more charter schools while also holding them accountable.

    How Technology Can Transform Education
    Brookings Institution
    Imagine a system in which teachers take on the role of coaches, students learn at their own pace, technology tracks student progress, and schools are judged based on the outcomes they produce.

    Everything’s Big in Texas… Except School Choice
    Texas Public Policy Foundation
    Texas has made strides towards school in choice in the past decade but the Lone Star State has a long way to go before it becomes a leader in education reform.

    How Are New Orleans Charter Schools Working Out?
    Rand Corporation
    Hurricane Katrina wiped out the old New Orleans public school system. Charter schools have flourished since then. Parents with children in charter schoolsย  experience greater satisfaction.

    How to Squeeze $2 Trillion out of Future Health Care Costs
    Urban Institute
    Obamacare did not begin to exhaust all the cost-containment ideas for health care. Start by capping the tax break for health care insurance, doing a better job of coordinating care, and enacting malpractice reform.