
 by John Butcher
Professor Excel is glad to sort the Division test results so let’s look at the top and bottom performers.
But first: On average, Virginia’s economically disadvantaged (ED) students pass at about 20% lower rates than their more affluent peers (Not ED). Thus, the overall division averages are affected by the relative percentages of ED students, which is not a performance metric. The excellent VDOE Build-A-Table offers data for both groups, so let’s look at them separately.
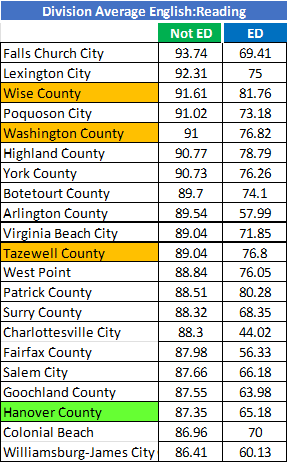
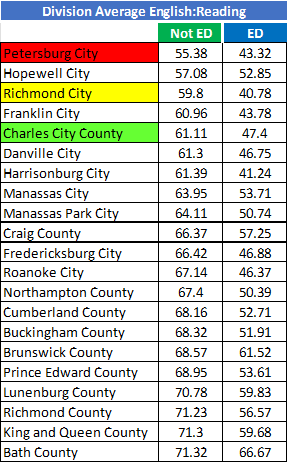
First, the top Not ED performers on the reading tests. The gold fills are Region VII founding divisions of the Comprehensive Instructional Program.
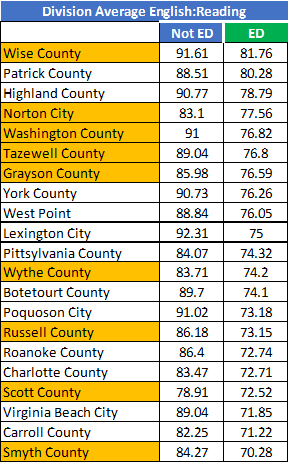
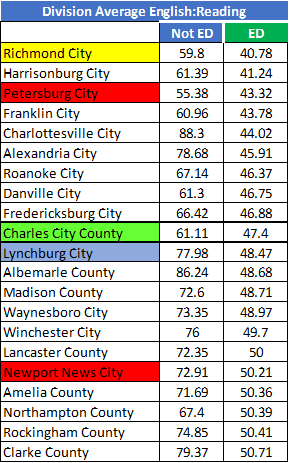
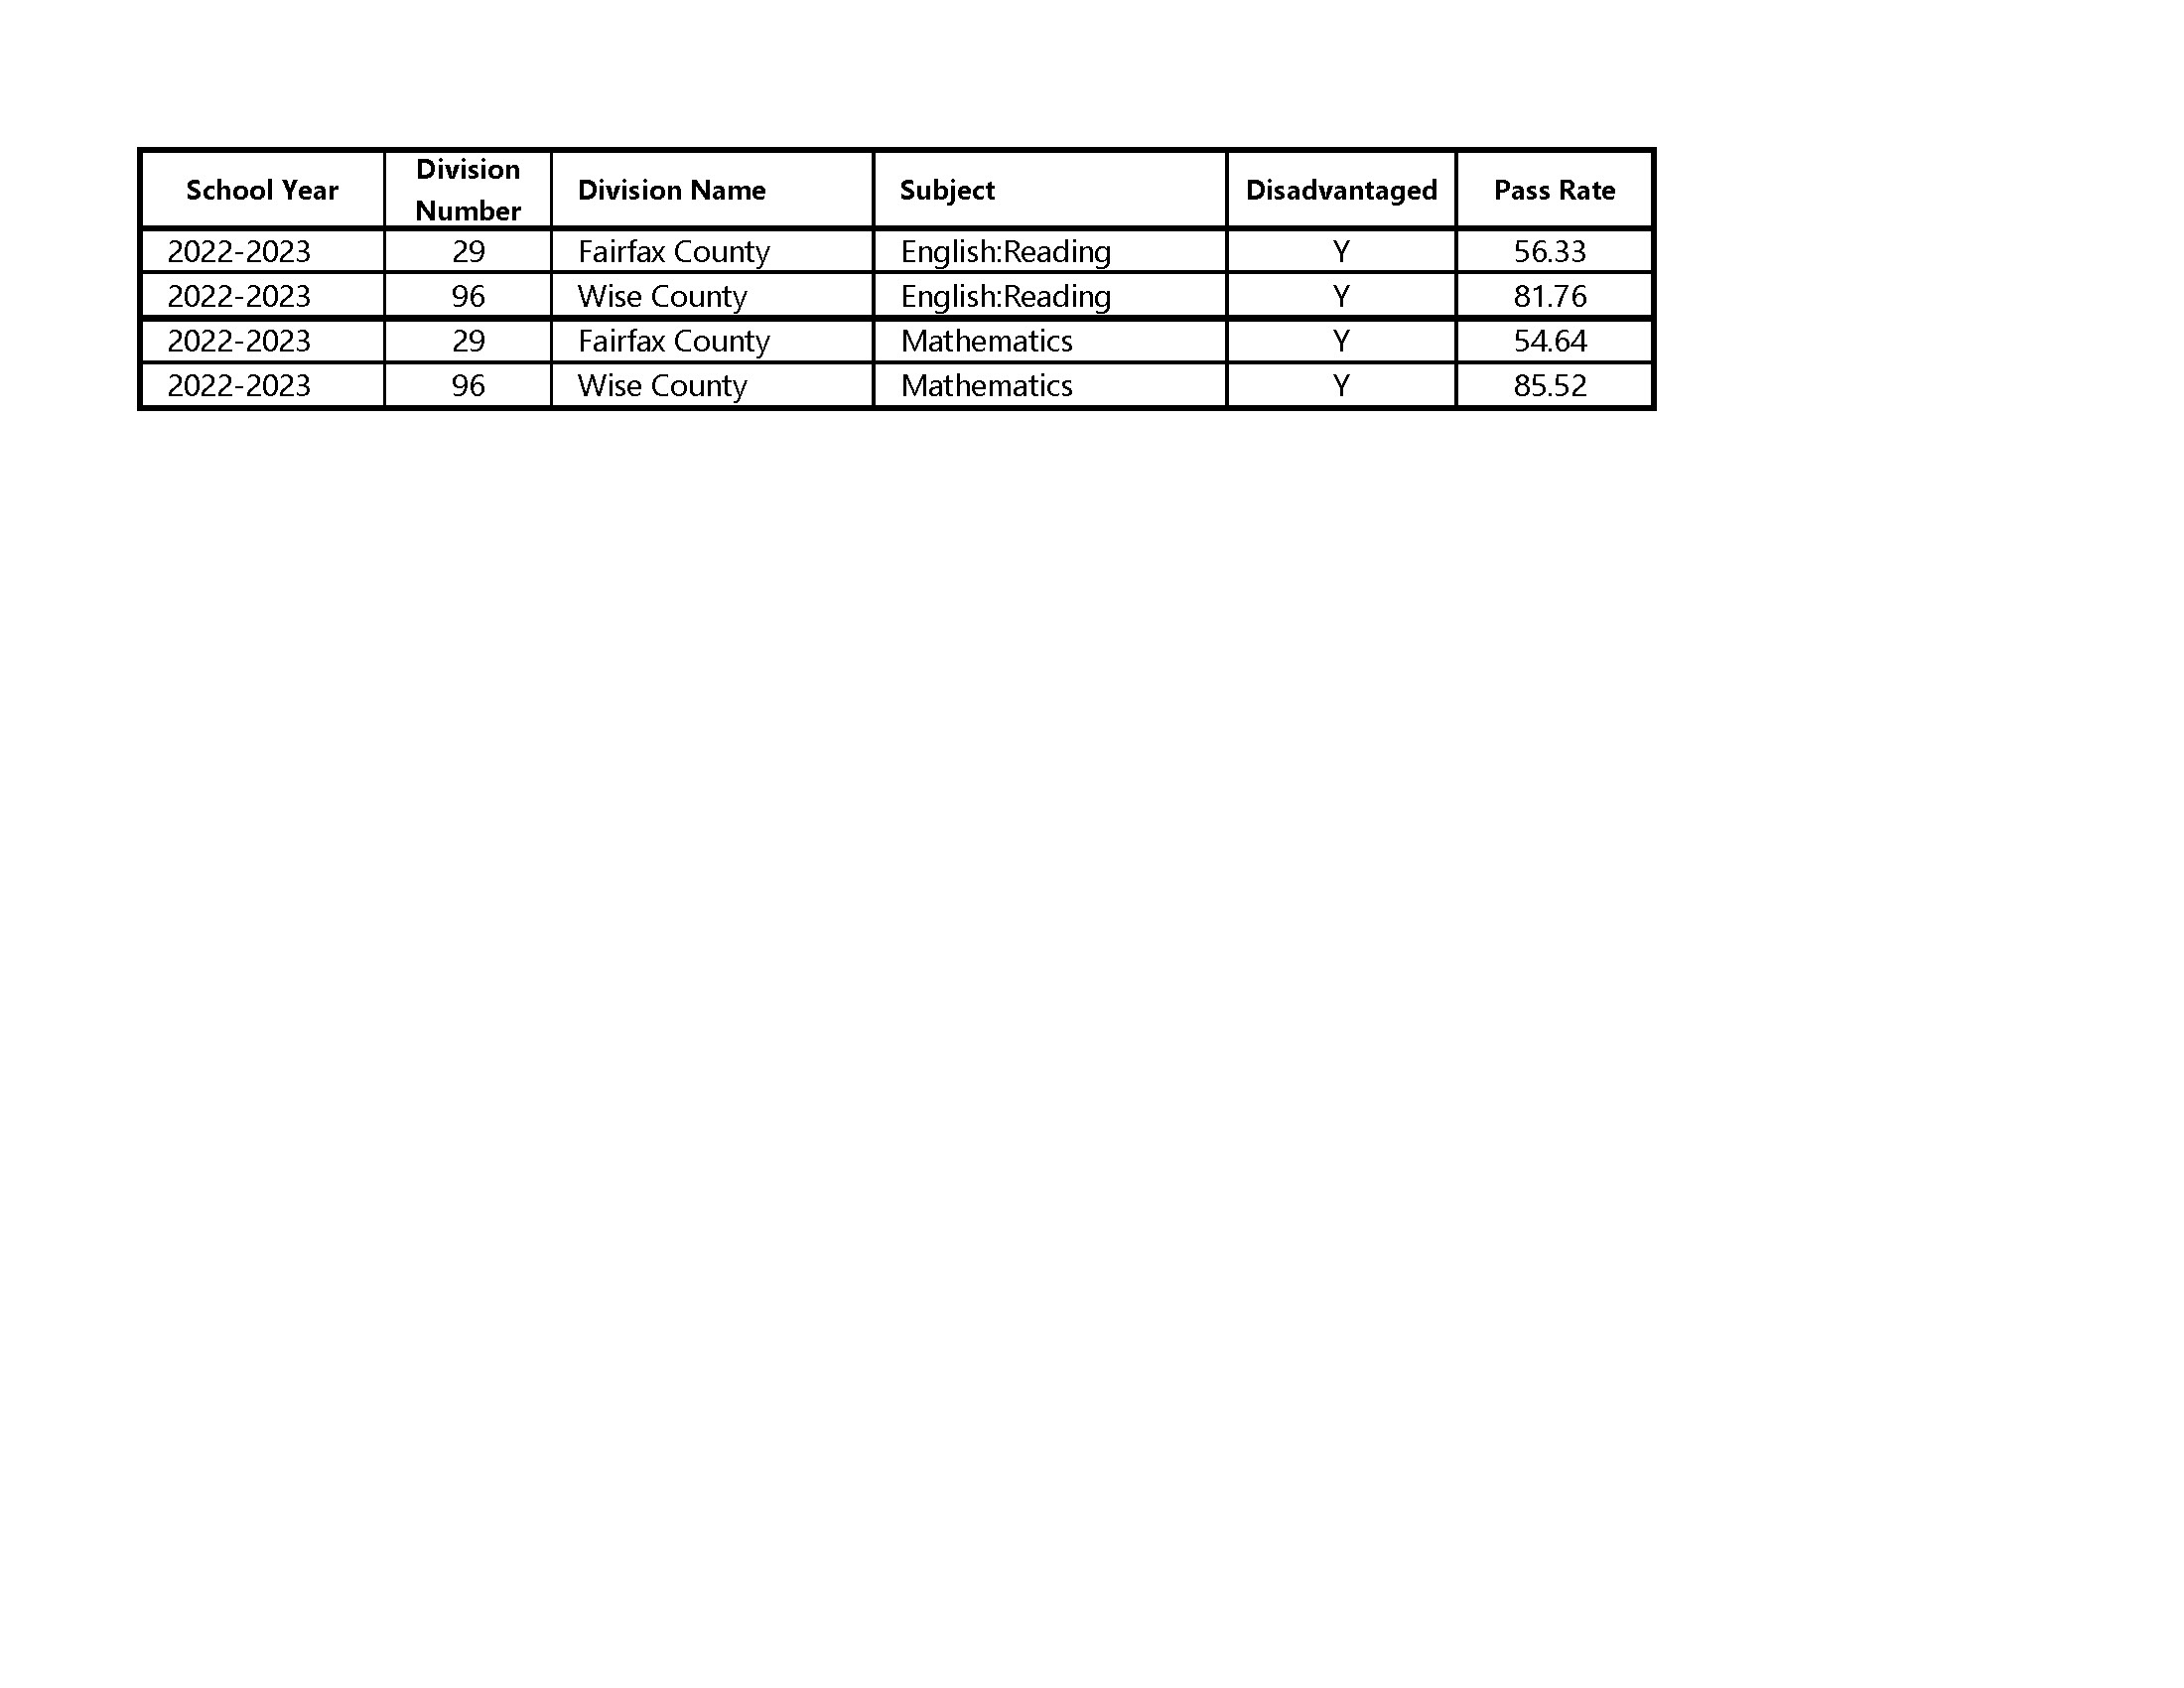
And the top ED divisions.
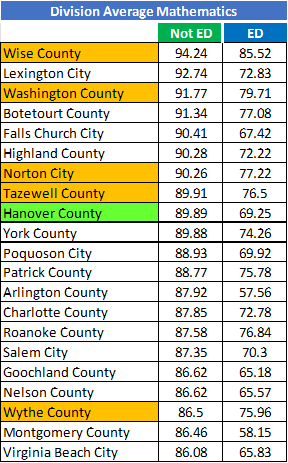
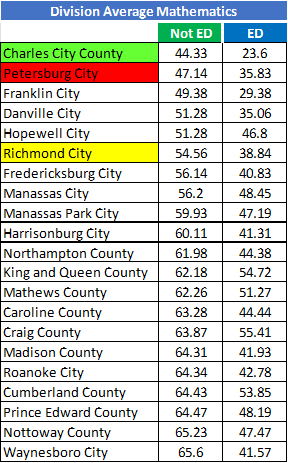
Next, math.
Next, the lowest division averages, starting with reading.
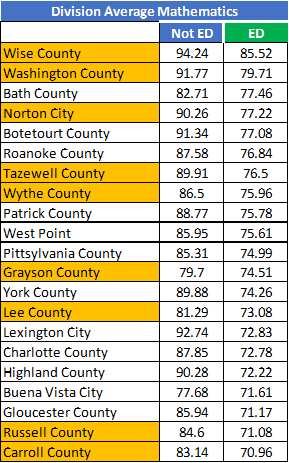
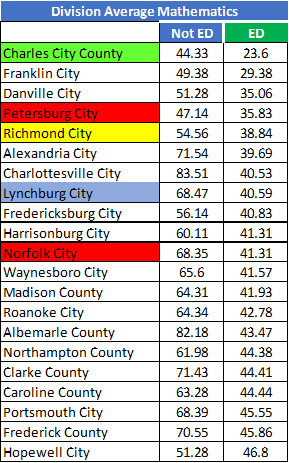
And math.
Republished with permission from Cranky’s Blog.
Leave a Reply
You must be logged in to post a comment.