
by James C. Sherlock
Richmond residents should note that:
The number of employees at City of Richmond in year 2020 was 4,140.
Average annual salary was $56,410 and median salary was $50,001. City of Richmond average salary is 20 percent higher than USA average and median salary is 15 percent higher than USA median.
Median per capita income in Richmond in 2020 dollars was $35,862. Median household income was $51,421. Approximately 21% of Richmond citizens live below the poverty level.
The City of Richmond’s FY 2023 total General Fund budget is estimated to be $836,015,828, an 8.18% increase when compared to the FY 2022.
The increases in spending represent a projected balanced budget based on estimated increases in revenues. Those in turn are driven by a projected increase in General Property Taxes – notably a 13.13% increase in real estate tax collections; increases in Sales Tax (9.27%); and increases in Prepared Meals Taxes (15.95%).
Those increases in tax collections are largely from Richmond taxpayers. How many got double-digit increases in income in 2022? Just asking.
Now the Richmond City Council is about to approve negotiations with its unions on pay and benefits. The RPS, of course has gone much further than the City Council in putting everything on the table.
Those costs are not in the budget.
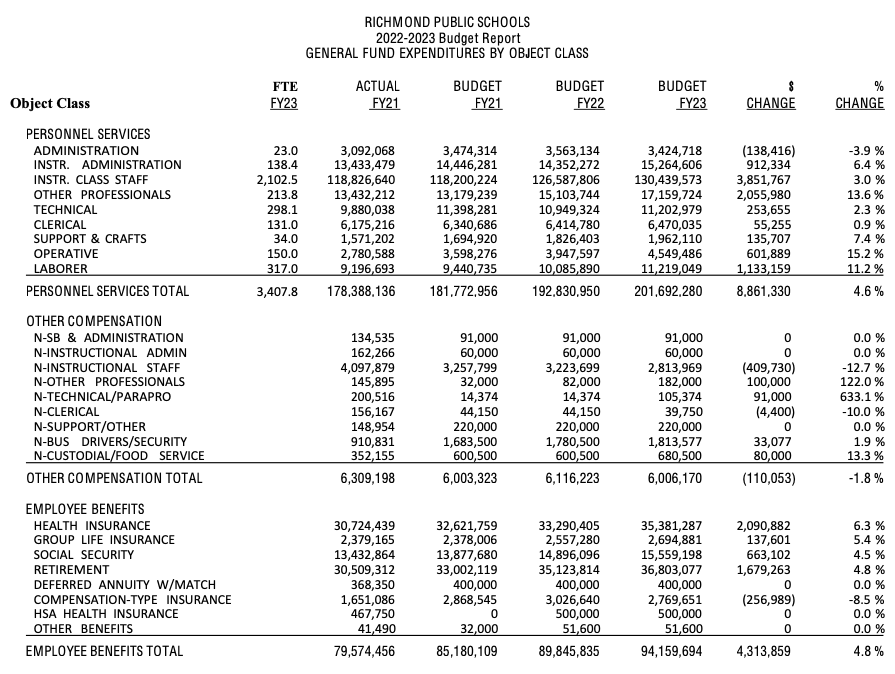
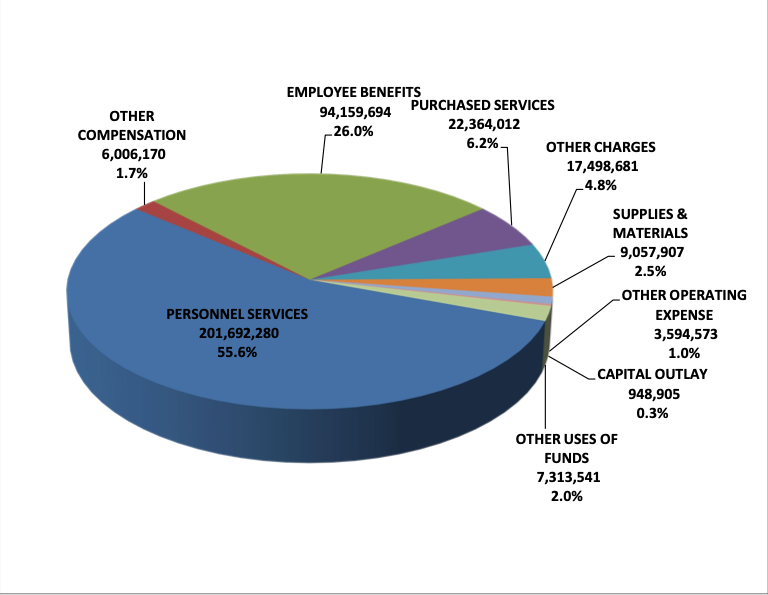
The Board of Richmond Public Schools (RPS) has gone even further. RPS projects 3,408 employees in FY 23, more than 1,2o0 of whom will be administrators. Eighty-three percent of RPS FY 23 expenditures will go to pay, benefits and other compensation.
The School Board committed ritual suicide with its December resolution that opens the day-to-day operations of the schools to union negotiations.
The city’s General Fund must pay for those increased costs. It can only do that by increasing local taxes and fees. The City Council will be on the hook to pay for the School’s Board’s profligacy as well as its own.
Both inflation and union negotiations over pay, benefits and, in the schools, much else can be projected to have outsized effects on Richmond taxpayers.
Solidarity Forever indeed.
RPS Budget Basics. We will focus now on RPS, realizing that the city will negotiate with its own unions but that RPS will be the cost driver.
RPS has two budgets: an Operating Budget and a Capital Improvement Plan (CIP) Budget.
The RPS Operating Budget covers all the day-to-day costs of running the school division: teacher salaries, curricular materials, transportation, and so on. In FY23, the RPS Operating Budget is projected by the Superintendent to be $554.4 million.
The RPS Operating Budget has a General Fund portion and a Special Revenue Fund portion. In FY23, the Superintendent’s Budget (not yet approved by the School Board) has about $362.6 million budgeted in the General Fund and about $191.8 million in the Special Revenue Fund.
The RPS General Fund covers most of the school division’s day-to-day operations. It is resourced nearly entirely by revenues from the Commonwealth and the City of Richmond.
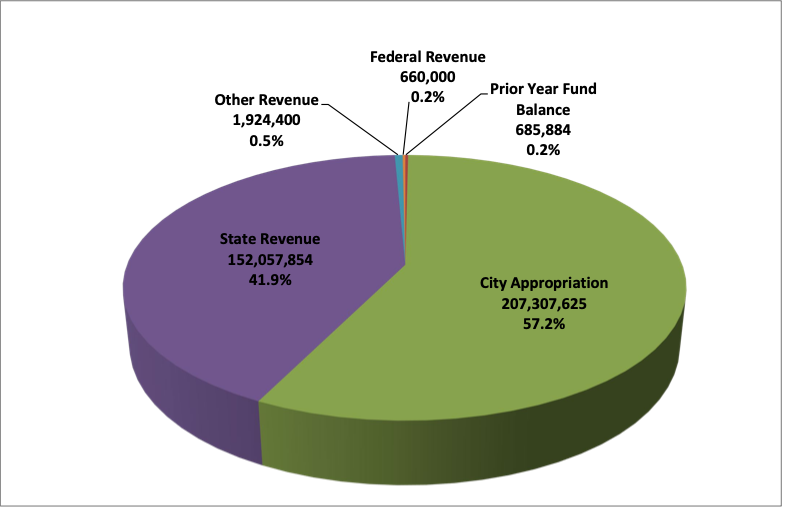
The Superintendent’s Budget anticipates the City General Fund will provide 57% ($207 million) to the RPS General Fund and State Revenue will contribute 42%.
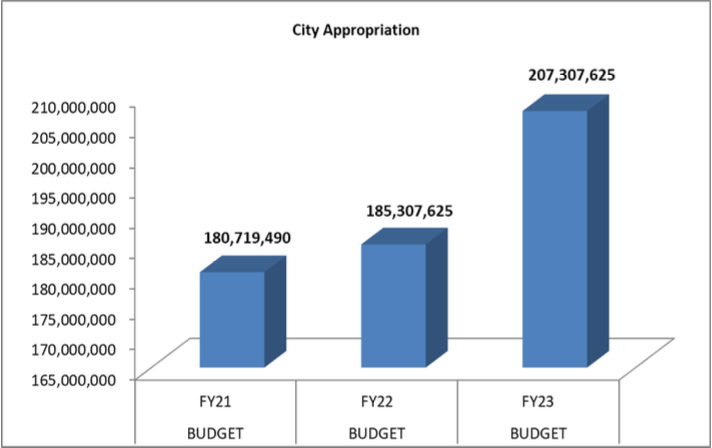
The Mayor’s budget currently has a $185 million placeholder for those funds, level with the previous year. There is a $15 million reserve in that budget.
State revenue for Richmond schools is forecast to decline year-over-year relative to the rest of the state because of a flat ADM and a significant increase in Richmond’s state-calculated ability-to-pay relative to other jurisdictions.
RPS Union Negotiation Variables. Consider the fiscal impact of changes negotiated with teachers unions to hours and scheduling, work rules and “quality of life” issues. Let’s say the work rules change shorten daily student-teacher contact hours to NYC’s current 3.75 hours.
How many more teachers will that require? And, revenue aside, where are they going to come from?
Richmond City Council, which must write the checks that result from School Board negotiations, is moving towards a much more conservative policy that puts only pay and benefits on the table.
But even those cost increases must be paid for.
Revenues. Tax proceeds are the primary source of revenue for the City’s General Fund.
- The bulk of tax revenue consists of general property taxes, which include real, personal, and business property. Tax proceeds are divided into general property taxes and other local taxes. The official real property tax rate is $1.20 per $100 assessed valuation. In 2019, only 42.6% of housing units were owner occupied. The national average was 64.1%. Rising taxes are passed on as rent increases to renters.
- How about citizen ability to pay? Net and comparative real estate tax information from tax rates.org:
Richmond City collects, on average, 1.05% of a property’s assessed fair market value as (real) property tax. Richmond City has one of the highest median property taxes in the United States, and is ranked 394th of the 3143 counties in order of median property taxes. The average yearly property tax paid by Richmond City residents amounts to about 3.46% of their yearly income. Richmond City is ranked 387th of the 3143 counties for property taxes as a percentage of median income.
- Personal property taxes includes delinquent personal property tax collections. Personal property taxes are levied on the tangible property of individuals and businesses. For individuals, this tax is primarily on automobiles and recreational vehicles.
- Business personal property includes motor vehicles, furniture, computers, and fixtures. Business machinery and tools are taxed separately, as permitted by law. The tax rate on all personal property is $3.70 per $100 assessed value.
- Other property taxes primarily consist of machinery and tools tax, with minimal revenue added by the mobile home title tax.
- Other local taxes include consumer taxes (such as local option sales tax and prepared food tax), utility taxes on electric and gas consumption, state distributed taxes (i,e. communications tax), and business and other taxes.
- Intergovernmental revenue is composed primarily of payments from the Commonwealth. They include:
• State Payment for Social Services
• State House Bill 599 (Public Safety Revenue)
• Reimbursement for State Shared Expenses (incl. state share of educational revenue)
• All Other Intergovernmental Revenue
- Fines and forfeits.
Ability to pay and trends.
The Commonwealth calculates ability to pay for each school district each year. The formulas are controversial, but the data generated in support of the calculations are useful in this discussion.
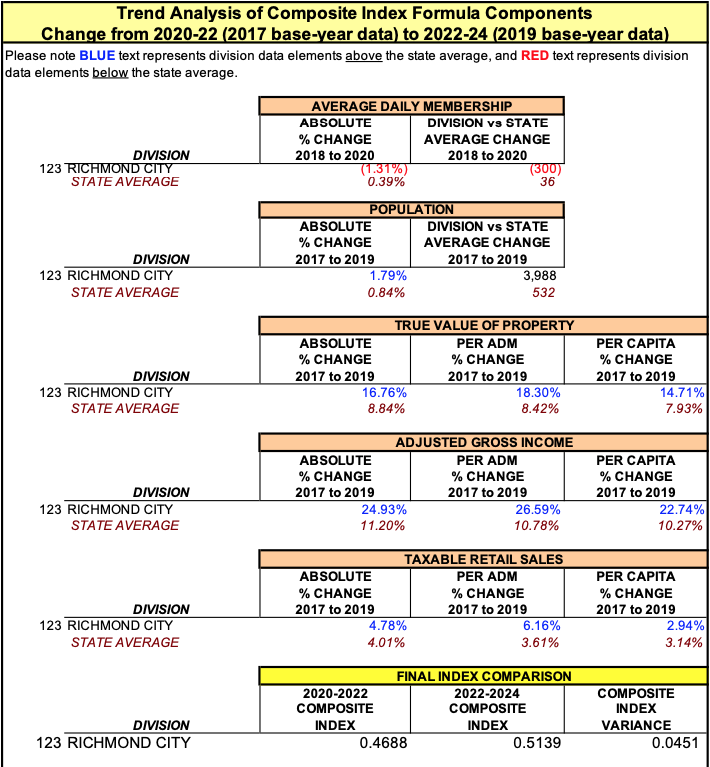
So, ADM went down and every thing else used to calculate ability-to-pay went up relative to the rest of the state. The change in the ability-to-pay composite index from .4688 to .5139 ensures Richmond a smaller share of the pot of state revenue, whatever that may turn out to be.
The increases in population, true value of property, AGI and taxable retail sales are already reflected in the city’s FY 23 budget.
So the citizens of Richmond and its visitors (sales taxes) are on the hook for union contract negotiations.
As I said, not a pretty picture. But Richmond citizens voted for the members of the City Council and School Board.
As ye sow, so shall you reap.
If reap is the word I am looking for.
Updated May 19 at 10:40 AM
Leave a Reply
You must be logged in to post a comment.