

by James C. Sherlock
I am a prolific reader and analyst of statistics about education. I find it constantly necessary to sort the wheat from the chaff. Chaff is the term I have chosen for this article, not the one I use in private.
The results of the latest Education Next Survey of Public Opinion (2022 poll) will appear endlessly in the press. EdNext has even graciously provided headline-ready assessments based on those results.
- “Partisan Rifts Widen, Perceptions of School Quality Decline“
- “Parental Anxieties over Student Learning Dissipate as Schools Relax Anti-Covid Measures”
- “Hunger for Stability Quells Appetite for Change: Results of the 2021 Education Next Survey of Public Opinion”
- “Parent Poll Reveals Support for School Covid-Safety Measures Despite Vaccine Hesitancy, Partisan Polarization”
Read the “Methodological notes” under “Notes” on the survey. Please also note that the links within those notes are both broken.
The parent sample includes oversamples of parents with at least one child in a charter school (305 respondents), parents with at least one child in a private school (310 respondents), Black parents (283 respondents), and Hispanic parents (429 respondents). The completion rate for this survey is 50%.” [Emphasis added.]
The judgments made from those data are breathtaking.
But are they justified by the data?
This is the type of chart that is created from the data.
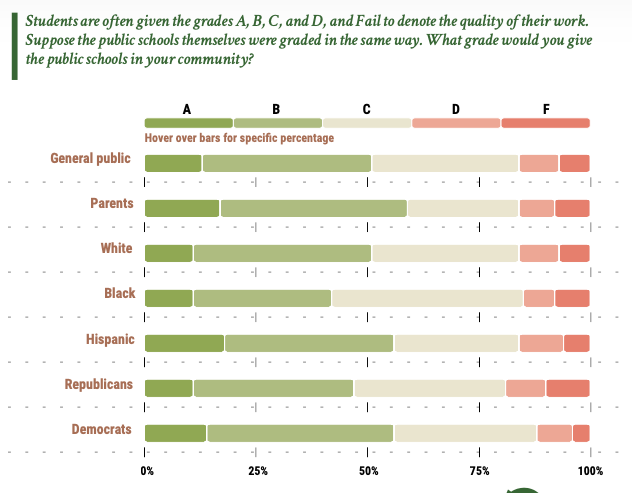
Dazzling.
So I assessed the admitted sampling errors among just parents.
- 1,327 of 1,857 (71%) of parent responses represented parent groups oversampled;
- Parents with one child in a private school oversampled by a factor of 2: survey 16.7% versus census bureau 8.2%; and
- parents with at least one child in charter school oversampled by at least a factor of three: survey 16.4% versus actual of less than 5.4%.
Note: the percentage of children in charter schools nationwide — 5.4% — does not account for parents with more than one child in charter school, which makes the parents with children in charter schools figure less than 5.4%.)
Those sampling errors seem formidable obstacles to producing such a chart.
Then there was the 50% completion rate. From the American Association for Public Opinion Research
Who refuses?
From the perspective of survey error, the principal concern regarding refusals is the possibility that sampled refusers are systematically different on the measures of interest in a particular survey than sampled participators across a range of demographic, attitudinal, and/or behavioral variables, so that their self-exclusion may bias results to a non-negligible extent.
The authors of Partisan Rifts Widen, Perceptions of School Quality Decline are successful academics. I am going to assume that they assessed this survey to be within the bounds of the rules of the American Association for Public Opinion Research when they ventured their sweeping analyses.
I personally don’t agree with using these flawed data for these purposes, but that is what makes a republic. People take in information, and then they vote.
As I wrote above, I am careful about surveys. I recommend being particularly careful about this one — and the press articles derived from it.
I put this survey in my personal “chaff” category.
The assessments derived from it I will call flares, burning bright. Briefly.
Leave a Reply
You must be logged in to post a comment.