
Tag: John Butcher
-
Performance Issues at TJ, Revisited
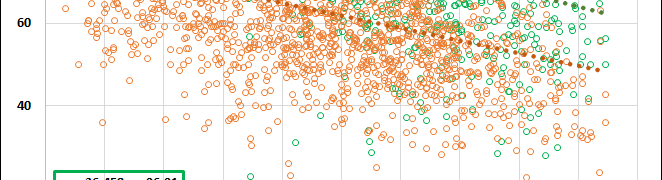
Increased enrollment of economically disadvantaged students seems to have had only a minor impact on academic performance. by John Butcher Responding to discussions (here, here, here, and here) of a new admissions policy and a decline in the US News ranking of TJ (aka Fairfax County’s Thomas Jefferson School for Science and Technology), I posted an analysis of the end-of-year test (“SOL”)…
-
SOL Scores: Post-Covid Recovery Still Incomplete
by John Butcher The 2025 SOL data are up on the VDOE Web site. This post looks at the statewide data. But First: VDOE reports pass rate averages for “economically disadvantaged” students (“ED” here, mostly those who qualify for free/reduced price meals), their more affluent peers (“Not ED”), and all students. ED students generally perform less well…
-
The Great and the Awful per the New Framework
by John Butcher The estimable Dick Hall-Sizemore has commented on some results of the new accountability Framework. Through the magic of Excel, we can excavate a much larger trove of information. Some background: the new system will take effect with the 2025 school year. There is a summary of the system here. As a warmup, VDOE has posted the Framework’s analysis…
-
Performance Problems at TJ?
by John Butcher The excellent Jim Bacon recently posted two discussions (here and here) of a recent decline in the ranking of TJ (aka, Fairfax County’s Thomas Jefferson School for Science and Technology). The excellent Dick Hall-Sizemore has penned a rejoinder. Jim points out declines from 2019 (i.e. pre-pandemic) to 2024 in math and science SOL pass rates; and the change in percentage of…
-
To Graduate or Not
by John Butcher The 2023 4-year cohort graduation rates are up on the Virginia Department of Education Web site. VDOE likes to report its “On-Time Graduation Rate” because it inflates the numbers by counting the nonstandard diplomas. The data below are the “Federal Graduation Indicator” that counts only the Standard, Advanced, and IB diplomas. On average,…
-
Virginia’s Top and Bottom Local School Divisions, 2023
by John Butcher Professor Excel is glad to sort the Division test results so let’s look at the top and bottom performers. But first: On average, Virginia’s economically disadvantaged (ED) students pass at about 20% lower rates than their more affluent peers (Not ED). Thus, the overall division averages are affected by the relative percentages…
-
Petersburg: Paradigm of VBOE Fecklessness, the 2023 Update
by John Butcher Despite nineteen years of “supervision” by the Board and Department of Education, the Petersburg schools marinate in failure. Va. Code § 22.1-8 provides: “The general supervision of the public school system shall be vested in the Board of Education.” Va. Code § 22.1-253.13:8 provides: The Board of Education shall have authority to…
-
The SOL Disaster
by John Butcher The 2023 test results (generally called “SOLs” but including results of other tests) are up on the VDOE Web page. Those numbers are not pretty. First, some background. 2020 was the first year without statewide SOL testing since 1997. Then came 2021, when participation in the testing was voluntary. The VDOE press…
-
Secret SOLs
by John Butcher The Superintendent of Public Instruction’s May 10, 2023, memo scheduled posting of the 2022-2023 student performance results to the Build-A-Table tool on August 17. Those data have not been posted. It’s not that they don’t have the information. The SOL data, in particular, are collected as they are produced by the online…
-
NAEP Before and After COVID
by John Butcher We’ve been hearing about the post-COVID declines in scores on the National Assessment of Educational Process (NAEP) tests. The NAEP database offers some (in fact, an abundance of) details. Here, as a small sample, are the 4th and 8th grade reading and mathematics data for the nation and Virginia. First, reading:
-
Dollars and Scholars
by John Butcher Table 15 in the 2022 Superintendent’s Annual Report includes the division expenditures per student for operations. Let’s juxtapose those data with the 2022 division Standards of Learning (SOL) pass rates. But first: Economically Disadvantaged (ED) students (those eligible for Free/Reduced Meals, receiving Temporary Assistance for Needy Families [TANF], eligible for Medicaid, or…
-
Graduates. And Not.
by John Butcher The U.S. Department of Education requires every state to annually report high school graduation rates. Those data, along with students’ performances on state assessments in subjects such as mathematics, English, and science, along with other measures, are also used to determine annual accreditation ratings. The VDOE’s website includes the Superintendent’s Annual Report…
-
Poverty and Performance in Virginia Schools
by John Butcher A recent study out of Stanford looked at 11 years of district-level National Assessment of Educational Progress (NAEP) data by race and economic disadvantage from all public school districts and concluded that racial segregation is strongly associated with the magnitude of achievement gaps in third grade and the rate at which gaps…
-
Truancy Morass
by John Butcher In a follow-up to his post on chronic truancy in Virginia, Capt. Sherlock writes, “We have decided, with laws reflecting our decisions, that children must attend school.” (Emphasis in original). If only it were that simple. Va. Code § 22.1-254 provides: Except as otherwise provided in this article, every parent, guardian, or…
-
2022 SOL Data: Economically Disadvantaged Gap Widens
by John Butcher 2020 was the first spring since 1998 without SOL tests in Virginia. Then came 2021, when participation in the testing was voluntary. The VDOE press release said, “In a typical school year, participation in federally required tests is usually around 99%. In tested grades in 2021, 75.5% of students took the reading assessment, 78.7% took…