
by John Butcher
The 2025 SOL data are up on the VDOE Web site. This post looks at the statewide data.
But First: VDOE reports pass rate averages for “economically disadvantaged” students (“ED” here, mostly those who qualify for free/reduced price meals), their more affluent peers (“Not ED”), and all students. ED students generally perform less well than the Not ED, see below. Most reports and, it appears, the new Accreditation system look at the all-students averages. That serves to unfairly penalize the divisions with large ED populations. A fair system would look at both groups and probably would emphasize the performance of the group that needs more attention, the ED. This post looks at the ED and Not ED data in addition to those for all students.
VDOE scores SOL pass rates on a 600-point scale. Scores above 500 are counted as Pass/Advanced. Those from 400 to 500, Pass/Proficient. The sum of those two rates in the overall pass rate. Note: The Board of “Education” lowered the cut scores to the current levels in 2020, creating modest uncertainty in the calculation of the pandemic’s effects. Topic for another day: As set out in the document at that link, Virginia reports proficiency at rates roughly double those published by the NAEP.
The 2021 testing was voluntary so that year’s data surely are not reliable measures. I’ve omitted them here.
The Big Two subjects for Accreditation (and, probably, for functioning in life) are reading and math. To a lesser degree, the accreditation process considers the science pass rates. For reasons that will become obvious, I’ll start with math.
Here are the 2015 to 2025 state average pass rates for the mathematics tests. The Board of “Education” relaxed the math standards in 2019, hence the bump in pass rates that year.
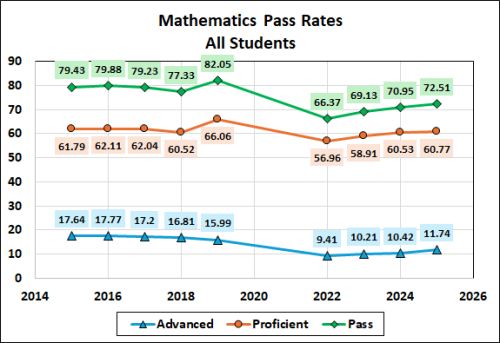
The drop from 2019 to 2022 gives a measure of the pandemic effect: 15.68 points for the All Students group, 6.58 for the Advanced, and 9.1 for the Proficient.
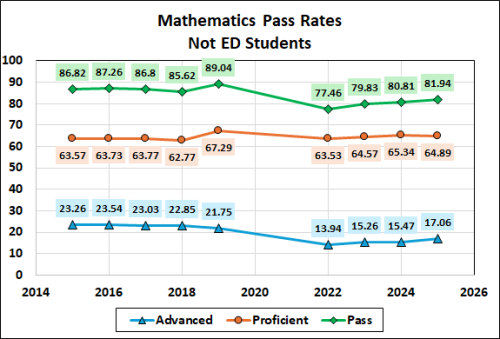
Turning to the Not ED data, the pass rate took a smaller hit than the All average, 11.58 v. 15.68:
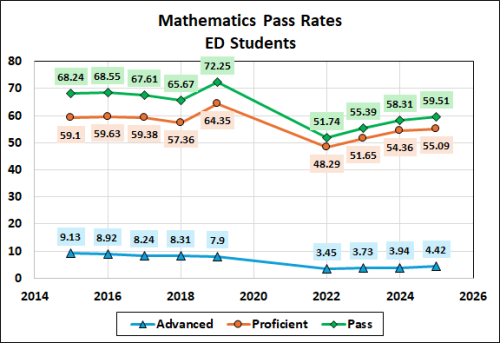
Meanwhile the ED average dropped a whopping 20.51 points.
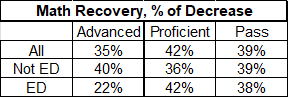
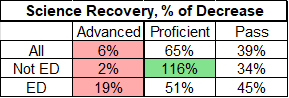
Here is a summary of the ‘22 to ‘25 recoveries as percentages of the ‘19 to ‘22 decreases.
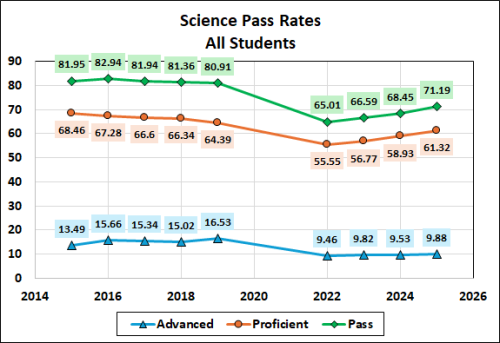
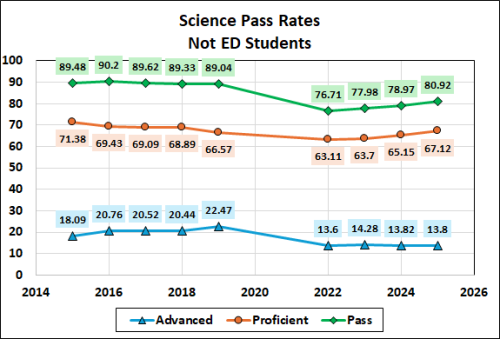
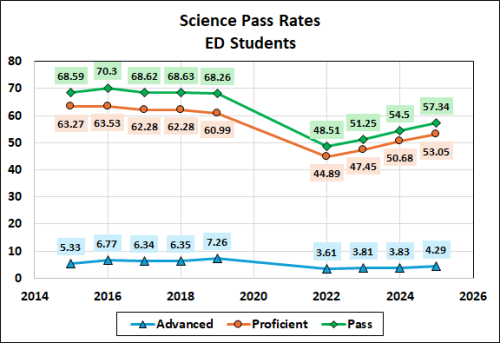
Next, science.
Finally, the Reading data.
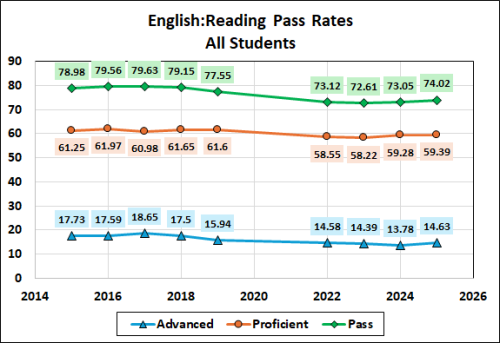
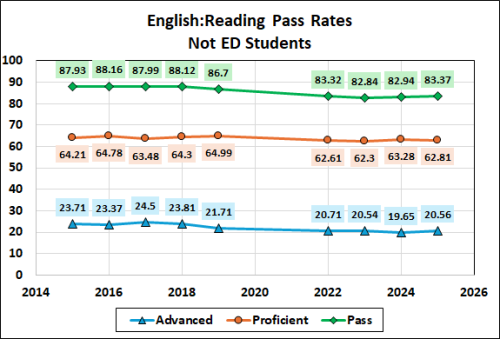
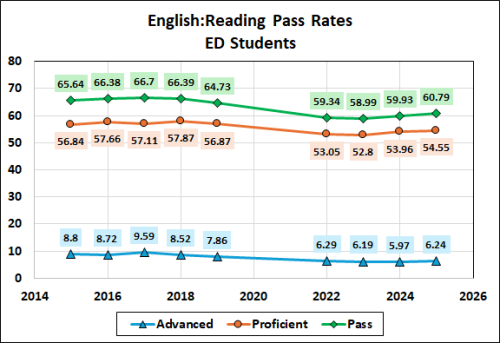

At first glance that looks like an anomalously modest pandemic effect, followed by recovery by the Not ED students to within a few points of the pre-pandemic levels. The actual change from 2019 is camouflaged, however, by a deliberate act of the Board of “Education”: In 2021 they relaxed the scoring for the reading tests. So, the only meaningful numbers here are the recovery (or two declines in the case of the advanced group) numbers, 2022 to 2025.
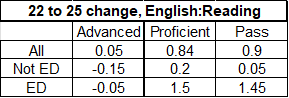
Those numbers are not encouraging.
The current Board has undertaken a major effort to reverse the earlier “systematic dismantling of high expectations” in math and English; this probably will interfere with the use of future post-pandemic data to assess performance versus the 2019 or other levels.
We are left with three conclusions:
1. The pandemic and our responses to it brutalized a 12-grade (probably 13 or 14 if you count kindergarten) span of students;
2. The recovery measures have been woefully inadequate; and
3. If the current (badly needed) focus on raising expectations results in higher standards (VDOE now has committees for math and reading), future measures of progress v. these data are likely to be problematic.
John Butcher, a retired attorney, lives in the Richmond area. This article is republished with permission from his blog, Cranky’s Blog.
Leave a Reply
You must be logged in to post a comment.