
by John Butcher
The estimable Dick Hall-Sizemore has commented on some results of the new accountability Framework. Through the magic of Excel, we can excavate a much larger trove of information.
Some background: the new system will take effect with the 2025 school year. There is a summary of the system here. As a warmup, VDOE has posted the Framework’s analysis of the 2024 data.
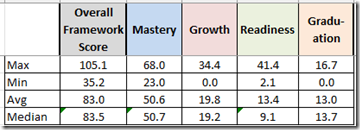
The byzantine process produces four sub-scores: Mastery, Growth, Readiness, and Graduation. These are multiplied by weighting factors and summed to produce an Overall Framework Score. The ranges of those scores look like this (here and below on the 2024 data):
In terms of the Overall scores, the top 36 schools (all that fit on my monitor) are these:
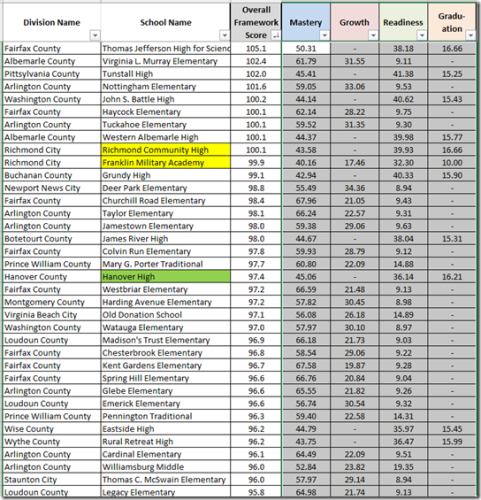
As any follower of the SOLs might expect, TJ tops the list and two of Richmond’s selective schools are near the top.
Also notice that four schools (in Buchanan, Washington County, Wise, and Wythe) in Region 7, home of the Comprehensive Instructional Plan, make this list.
Hall-Sizemore seems to take a positive view of Richmond when he says that “the much-criticized Richmond public school system had two schools in the top ten, while the neighboring counties of Henrico and Chesterfield had none.” He certainly is right about that count, but he neglects to look at the other end of the list (here sorted by increasing Framework Scores), where a Richmond school is closest to the drain in this academic cellar:
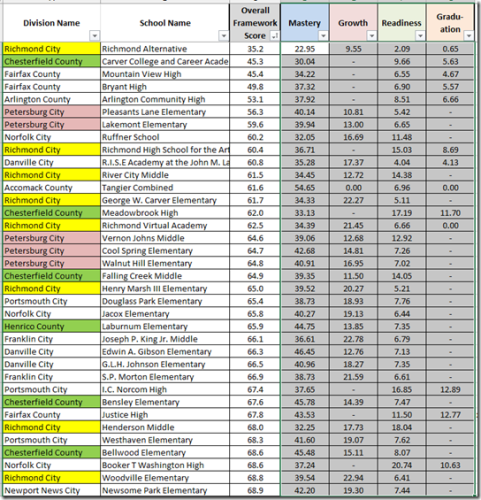
But, overall, Richmond falls behind Petersburg in its race to ignominy: Richmond has 8 schools on this list of its 43 (19%) v. Petersburg, 5 of 6 (83%). (The sixth Petersburg school, the high school, scored a 71, 2.1 points off the high end of this list and twelve points below the average.)
Notice that the counties also intruded into this cellar (Chesterfield four schools, Henrico one).
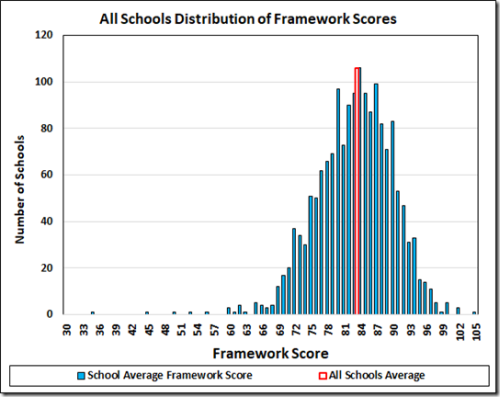
Here is the score distribution for all of the schools. The height of the average bar is arbitrary. Also its location is 1/2 point off (due either to Excel being arbitrary or my understanding of it being deficient).
Here is the list of averages of Framework scores of the schools in each division. This is not the division average (average over all students in the division) but it’s what the VDOE spreadsheet can give us.

Madison County at 82.6 sits right on the average. The light blue are the Region 7 founders of the CIP. Green are the Richmond ‘burbs.
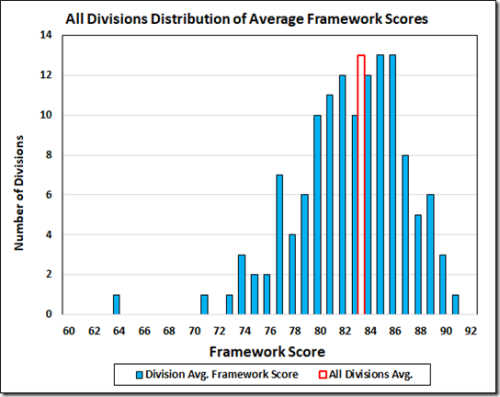
Here is the distribution of those division averages.
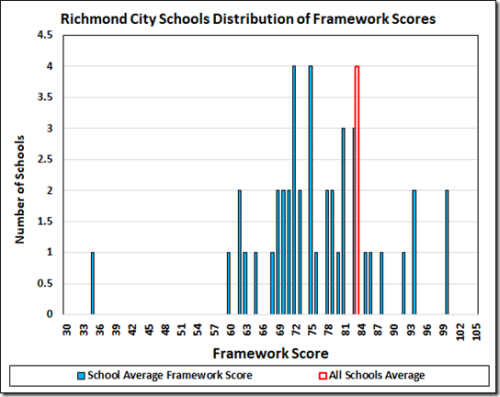
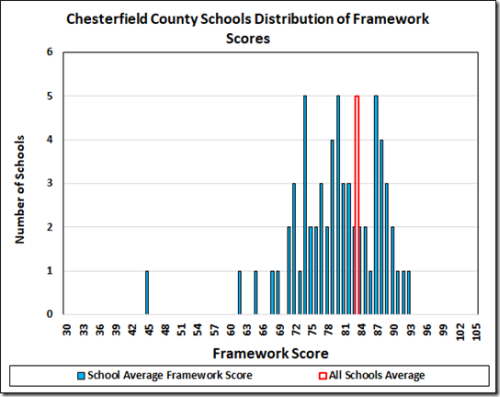
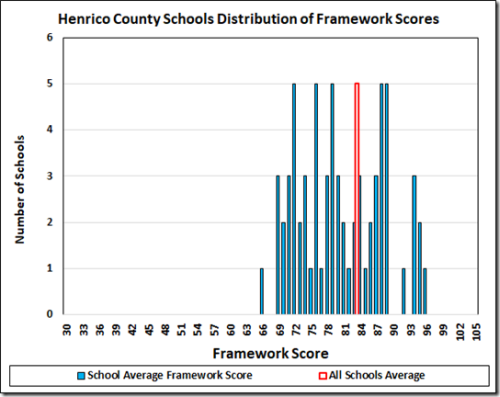
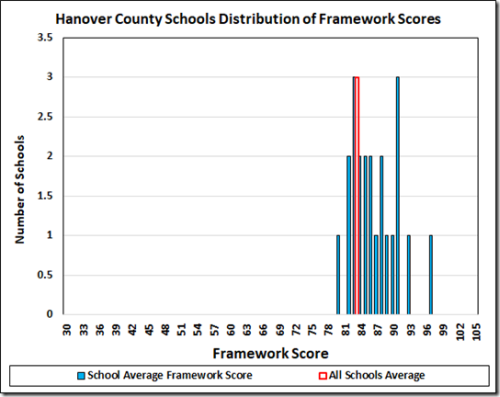
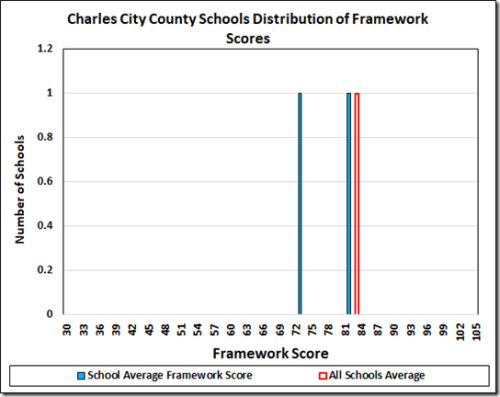
Finally, here are the distributions of some selected divisions, starting with Richmond.
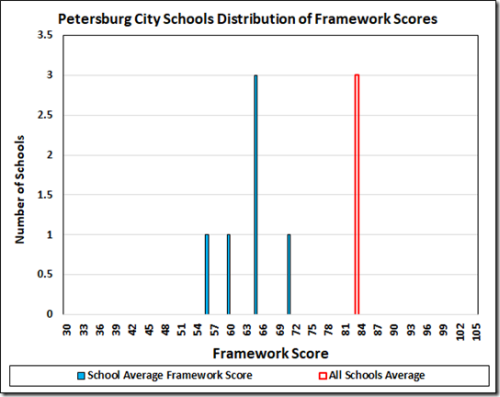
Petersburg.
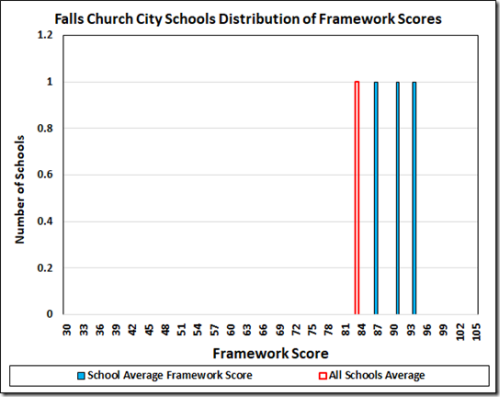
Falls Church.
And the Richmond ‘burbs:
Leave a Reply
You must be logged in to post a comment.