
Increased enrollment of economically disadvantaged students seems to have had only a minor impact on academic performance.
by John Butcher
Responding to discussions (here, here, here, and here) of a new admissions policy and a decline in the US News ranking of TJ (aka Fairfax County’s Thomas Jefferson School for Science and Technology), I posted an analysis of the end-of-year test (“SOL”) data through 2025. Since then, I’ve had a chance to try to think more clearly (says he), with the following results.
But first: VDOE reports pass rate averages for “economically disadvantaged” students (“ED” here)(mostly those who qualify for free/reduced price meals, i.e., this is the bureaucratic euphemism for “poorer”), their more affluent peers (“Not ED”), and all students. ED students generally perform less well than the Not ED, see, e.g., this. Most of the VDOE reports and, it appears, the new Accreditation system (and, also, the US News rankings, see below) look at the all students averages. That serves to unfairly penalize the schools and divisions with large ED populations (and to benefit those, such as TJ, with a small ED group). A fair system would look at both groups and probably would emphasize the performance of the group that needs more attention, the ED. This post looks at the recent ED and Not ED data for TJ, in addition to the all students results.
VDOE scores SOL tests on a 600 point scale. Passing is 400. As well, there are two “pass” classifications. Scores above 500 are counted as Pass/Advanced; those from 400 to 500, Pass/Proficient. The sum of those two rates in the overall pass rate.
The 2021 testing was voluntary so that year’s data surely are not reliable measures. I’ve omitted them here.
To start, a helpful VDOE database gives us the “Fall Membership.” Here is the dataset for TJ:
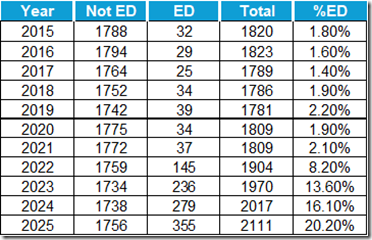
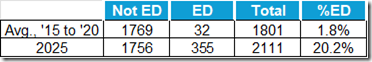
In short, the ED enrollment increased by more than a factor of ten to about 20% of the total from 2021 to 2025 while the Not ED count remained nearly constant.
The Big Two subjects for Accreditation (and, probably, for functioning in life) are reading and math. To a lesser degree, the accreditation process considers the science pass rates.
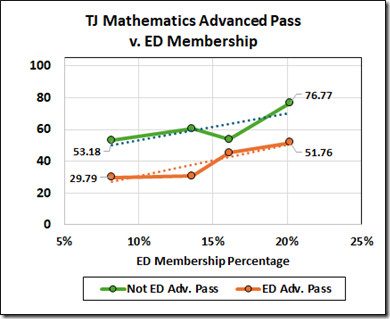
Let’s start with the SOL pass rates for math.
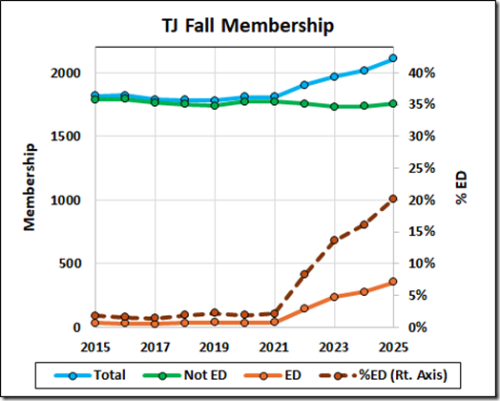
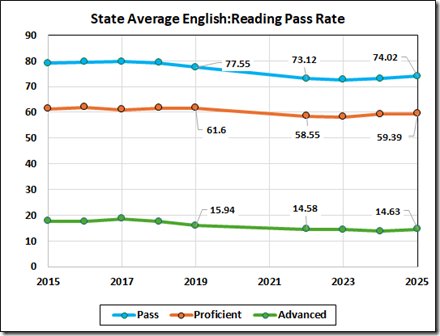
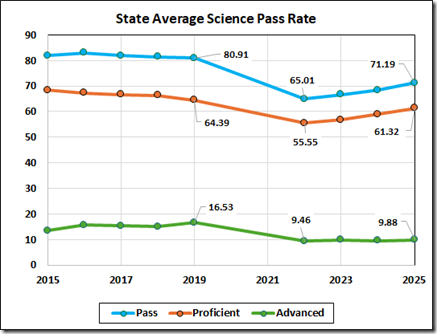
For context, here are the 2015 to 2025 state averages.
Notice that the Advanced group is only about a third the size of the Proficient. The post-pandemic drop in the pass rate is 15.7%, most of it, 9.1%, coming from the (larger and lower scoring) Proficient group.
Turning to TJ:
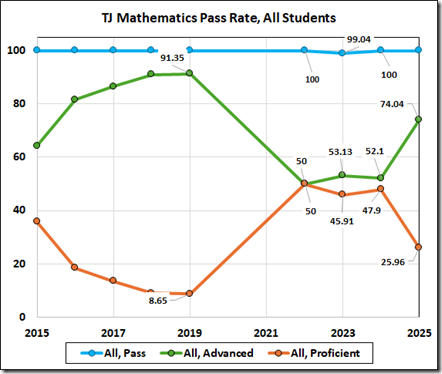
TJ shows quite a different picture. The pass rate is 100% except for a blip in 2023. In 2019, the Advanced group was over ten times a large as the Proficient. The pandemic effect shows up not in failures but in a 41 point drop in the number of Advanced scores.
Pandemic or not: Those TJ kids are not flunking the math tests.
Looking beneath the hood, here are the average pass rates of TJ’s more affluent students.
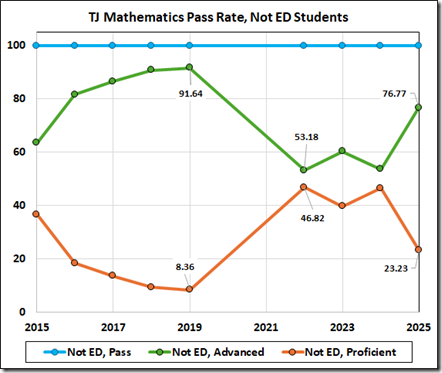
The post-pandemic pass rate for this group was unchanged from the 2019 rate (at 100%, of course), but the Advanced rate decreased by 38.5% with a corresponding increase in the Proficient rate. The 2025 increase marked a 23.6 point recovery from that decrease.
Next, the ED data:
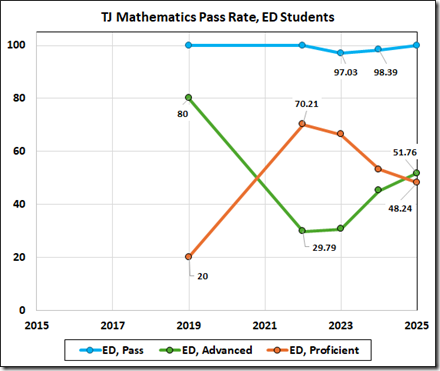
The absence of ED data before 2019 reflects the small ED memberships and the VDOE suppression rules for small groups of students.
The ED database shows TJ students failing the SOL tests: 3.0% of the ED group in 2023, 1.6% in 2024.
(Notice that the all student pass rate for 2024, above, is 100%, obviously rounded up. More on that below.)
The ED Advanced pass rate started lower than the Not ED in 2019, 80 v. 91.6%, and fell farther as of 2022, 50.2 points v. 38.5. As of 2025, the ED group recovered 22 of that 50.2 points.
In short: The ED students at TJ started lower than their more affluent peers, suffered a larger post-pandemic fall, and showed a smaller recovery as of 2025. The Good News: Both groups are improving (at the same time the ED population is increasing).
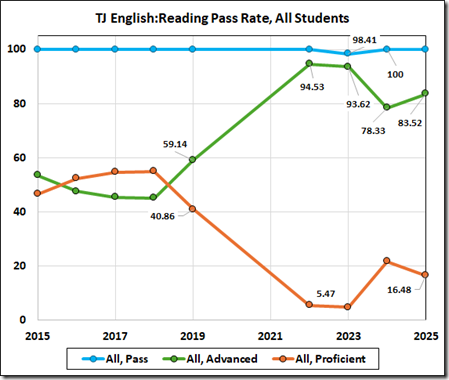
Turning to the reading tests:
In light of the 15.7 point post-pandemic decrease in the state average math pass rate, the 4.43 drop in the reading number might come as a surprise if we didn’t already know that the Board relaxed the scoring in 2021. With that information we can be prepared, some, for post-pandemic increases in the TJ Advanced rates.
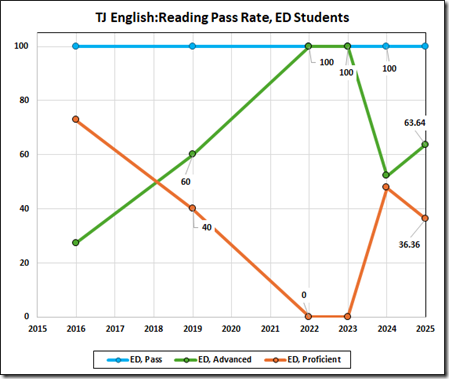
The scoring change looks to have had a nearly miraculous effect on the ED rate (that lasted only until 2024).
Notice the 1.6 percent failure rate on the 2023 reading tests.
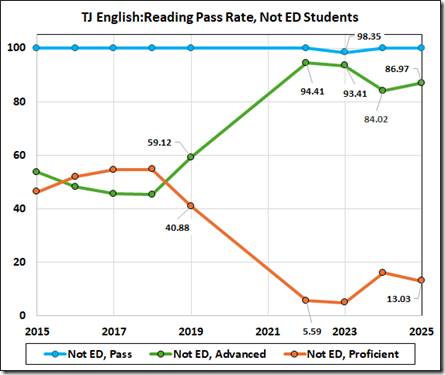
The surprise here is the 15.3 point 2024 decrease in the all student rate, comprised of a 10.4 point decrease in the Not ED rate and a 47.8 point plunge in the ED number. This comes after two years of 100% ED and 93%+ Not ED performance. Something caused this decrease but these data do not tell us what it was.
Both groups recovered some in 2025.
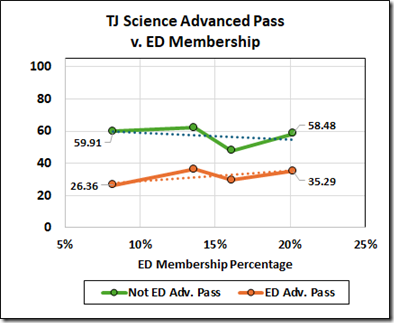
Finally, the science data:
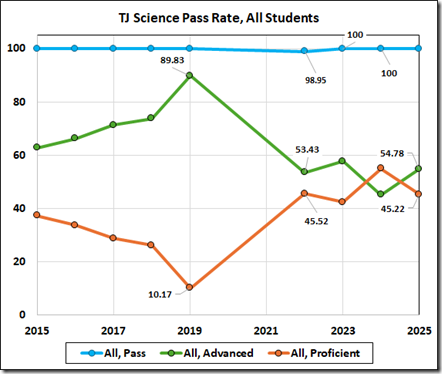
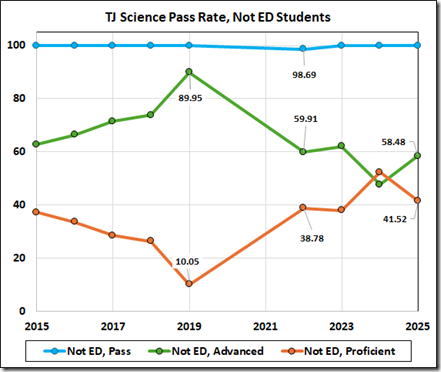
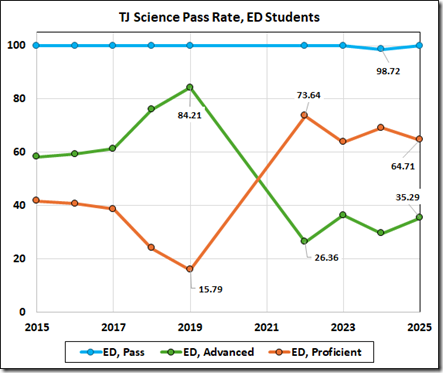
The ED rates for science were close to the Not ED before the pandemic. Not after, though. And, as to the 2022-2025 period, the rate shows a mere 1.35 point improvement, driven by the ED (+ 8.94), despite a decrease in the Not ED (-1.43).
As we have seen, beginning in 2022 the membership data show consistent increases in the ED population, reflected in the total membership. How does performance change with those increases?
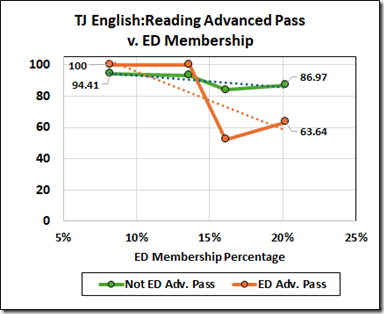
In sum:
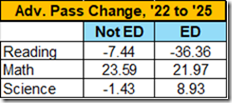
In short: Reading is down; math about flat; science up a bit, driven by an ED increase. On these data it is difficult to infer a relationship between SOL performance and the enrollment changes at TJ.
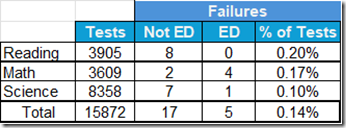
On the subject of rounding up to a perfect 100: Here is a summary of the 22 post pandemic-failures at TJ, along with the reported pass rates and those calculated from the raw counts. The roundings up to perfect are shaded in yellow.
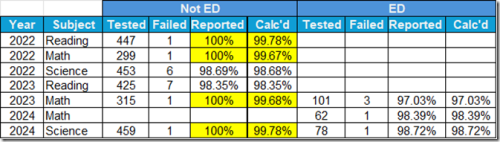
The database shows a 99.67 and three higher rates reported as “100” but no round up of a 98.72. Apparently VDOE rounds up somewhere in between those two values.
When VDOE otherwise reports the data to two decimal places, it would be hard to understand why they would round up to none except that they do like to make the schools look better than their actual performance would imply.
Aside from VDOE’s generosity with the numbers, here is a summary of the post-pandemic failures at TJ:
What shall we conclude from all this?
First, we can notice that TJ is a very fast track. With minor exceptions, all the TJ students passed these tests. The difference in ED/Not ED performance at TJ is not measured by Pass/Fail but but in whether the pass scores are Advanced. By that measure, TJ’s ED students perform at a lower level of excellence than the Not ED do (as do ED students elsewhere, as measured in the pass rates). That said, the increasing ED enrollment does not seem to be harming performance of either group except perhaps for the 2024 ED anomaly in reading; indeed, post-pandemic math performance of both groups looks to be improving.
TJ suffered a major 2024 decrease in reading performance, especially among the ED population. In the absence of similar decreases in the other subjects, we probably should look beyond the population change for an explanation.
JT fell from #1 in the 2022 US News ranking to #14 in 2024. This year TJ is back up to #5. We have only a smattering of data regarding that. The magazine publishes a “Scorecard” for TJ in 2025 ; we can juxtapose it with the data from VDOE.
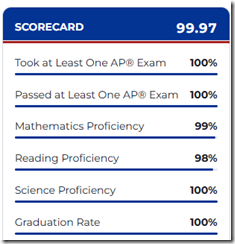
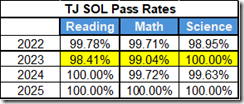
That comparison suggests that the US News ranking for this year used TJ data from 2023. My meagre skills were not sufficient to extract earlier scorecards from the Wayback database so I can’t comment on the year-to-year variation of the US News numbers.
Back to the enrollment changes: The changes at TJ are offering more exposure for a first-rate education to some capable, less affluent students and denying that exposure to the same number of higher performing, more affluent students. Whether that is desirable is a policy call. About all these data can say is that the increases in ED enrollments at TJ do not seem to be harming the quality of performance there.
John Butcher is a retired attorney living in the Richmond area. This column has been republished with permission from Cranky’s Blog.
Leave a Reply
You must be logged in to post a comment.