
There is some mildly good news for Virginia from the latest National Assessment of Educational Progress (NAEP) tests, commonly called the Nation’s Report Card. Virginia 4th graders improved their performance in mathematics, while 8th graders made incremental gains in both math and reading. Virginia students also maintained a significant edge over their peers nationally in math and reading in both grades.
“For the first time, 50 percent of Virginia fourth graders achieved at or above the proficient level in mathematics, with 12 percent earning advanced scores,” states the Virginia Department of Education press release. “Students in no other state performed at a statistically higher level.”
NAEP results are based on representative samples of students in each state. The 2017 NAEP sampling of Virginia students included approximately 2,300 fourth-grade students and 2,200 eighth graders.
As is their wont, state officials took note of “achievement gaps between white students and their black and Hispanic peers.” The press release elaborates: “The percentage of black eighth graders achieving proficient or advanced math scores increased by eight points, to 20 percent in 2017, compared with 12 percent in 2015. While this represented a significant gain for black students, the improvement did not translate into a statistically significant narrowing of the achievement gap with white students.”
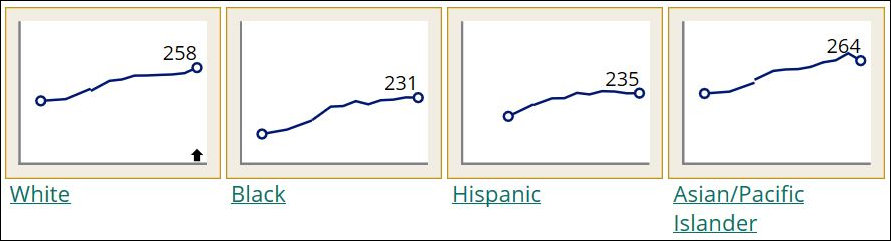
No mention of Asian students who comprise 8% of Virginia’s population. Why would that be? Perhaps the answer can be seen in the charts atop this page. There we can see that Asian/Pacific Islanders (which in Virginia means Asians because there aren’t many Pacific Islanders here) achieved the top scores. Thus, the “achievement” gap can also be seen as an Asian-white achievement gap, an Asian-black achievement gap, and an Asian-Hispanic achievement gap.
Why do state officials make whites the standard against which blacks and Hispanics measured? In order to advance the dominant narrative about race, of course. Setting Asians as the standard for comparison would confound the conventional wisdom. Perhaps Virginians would be compelled to ask why Asians out-perform other ethnic groups, including “privileged” whites. We would have to ask ourselves, do Asians attend better schools… or do they tend to out-perform in all schools? Don’t they face discrimination? If not, why not? Why are they disciplined at lower rates than other groups, including whites? Are they less likely to be disruptive in class? Do they study harder?
Setting Asians as the standard against which others are measured would force us to consider the role of intact families, personal behavior, and cultural norms and expectations rather than view racial/ethnic disparities through the lens of white privilege and minority oppression.
The focus on the white-black/Hispanic gap also conveniently ignores the English-fluent/English-as-a-second-language gap. For example, according to NAEP data, the score gap between 4th grade whites and Hispanics is 23 points. But the gap between English-fluent and English-as-a-second-language students is 36 points. Given the fact that Hispanics are more likely to not be English fluent, facility with the English language likely explains much of the white-Hispanic gap.
How much of the gap disappears when you compare whites with English-fluent Hispanics? How much of the broader white-Hispanic gap should be attributed to white privilege and how much should be attributed to the influx of poor, ill-educated immigrants from Mexico and Central America who have an immense amount of catching up to do? That question never gets asked.
Unfortunately, the searchable NAEP database does not allow us to make that comparison. What a surprise. I guess it never occurred to NAEP officials that such a comparison would be worthwhile. It would be nice if state educators would get over their black/white obsession and begin asking a wider range of questions.
Leave a Reply
You must be logged in to post a comment.