
It’s not new news anymore that gains in life expectancy have leveled off in the United States, driven by startling and unexpected declines among young and middle-aged whites. The so-called “deaths of despair,” including drug overdoses, are on the rise. So are liver disease (associated with alcoholism) and suicides. Chronic diseases associated with obesity such as diabetes, heart disease, and stroke are up, too.
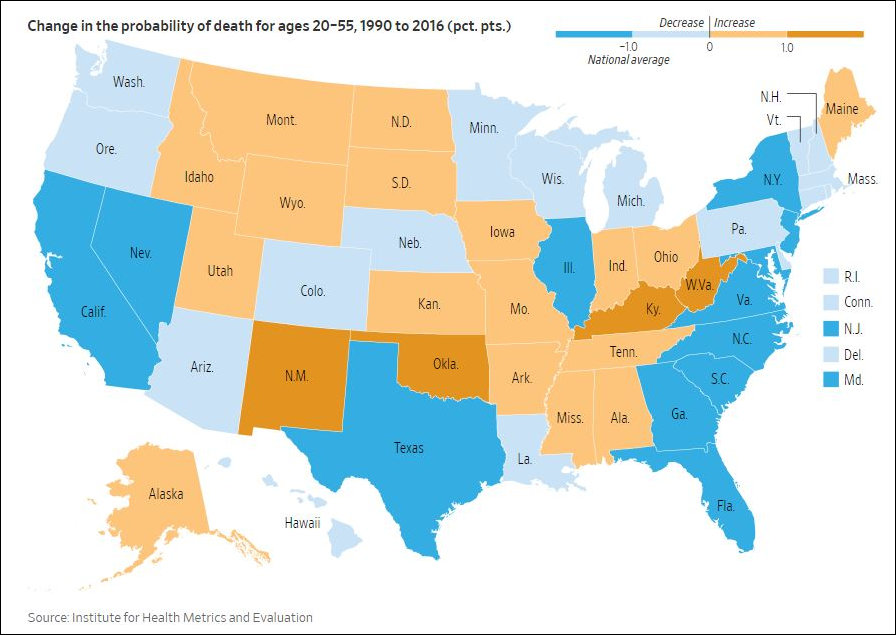
The map above shows changes in the probability of death among 20- to 50-year-olds in the 50 states between 1990 and 2016. There is a remarkable divergence — health for this age group has improved significantly for some states, including Virginia, and gotten worse for others.
A breakdown by county in Virginia would be revealing. I hypothesize that western Virginia, especially the far Southwest, would show patterns similar to neighboring West Virginia and Kentucky. Although a more granular look at the data might reveal a different pattern, it appears that Central Appalachia is ground zero for deaths of despair.
Leave a Reply
You must be logged in to post a comment.