
From the Institute for Family Studies:
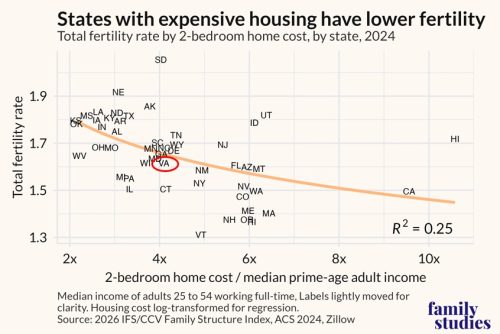
The US fertility rate hit a record low in 2025. But fertility rates vary significantly across states, ranging from under 1.4 children per woman in states like Vermont and Oregon to over 1.9 in Nebraska and South Dakota. IFS’s Family Structure Index found that housing affordability explains 25% of this variation in total fertility rates, rising to 31% when outliers California and Hawaii are excluded. Expensive housing suppresses fertility by creating budget constraints, shifting young families into smaller housing, and driving the migration of families to more affordable areas. IFS senior fellow Lyman Stone offers one solution to the fertility decline: build family-friendly housing.
Note: Judging from the chart above, Virginia is slightly below the trend line, with fertility rate and housing costs as a ratio of prime-age adult income both in the middle of the pack nationally.
Leave a Reply
You must be logged in to post a comment.