
By Steve Haner
Two prominent American climate researchers who focus on data rather than models have examined 40 years of summer temperatures at Reagan National Airport. They found the hottest summer days are barely warmer than in the 1980s, an imperceptible change, but the coolest overnight temperatures have gotten dramatically warmer.
The change in the hottest daily highs amounted to half of one degree Fahrenheit but the coolest of the overnight lows were 5 degrees warmer. This is not the first time it has been demonstrated that mainly what has happened over recent decades is the nights are less cool, especially in urbanized areas. But this was a key Virginia weather station in Virginia’s most populous region reinforcing the point.
John Christy and Roy Spencer have long been interested in and published about the impact of human urban development on the “climate change” or “global warming” so widely reported. They are also two of the five authors of a recent Department of Energy report on the claims that greenhouse gas emissions are the culprit, a report that disputes the alarmist conclusions. The “scientists” who accept the “consensus” are in court trying to suppress the report, so I wanted to give you a chance to download and read it.
Christy was cited in a previous Bacon’s Rebellion post of mine making similar points about how what is seen as overall global warming was really about the nighttime temperatures. If greenhouse gases such as carbon dioxide or methane are the main cause of the rise, it ought to be uniform with no big disparity between daytime and nighttime changes, Christy says.
Both are affiliated with the University of Alabama at Huntsville, and they publish the temperature measurements of the lower troposphere ( ±14,000 feet) derived from satellite data. A pattern of gradual warmth also appears in that tracking, and many feel the satellite view is more reliable than the reports from scattered ground stations. But we only have about 45 years of the satellite measurements.
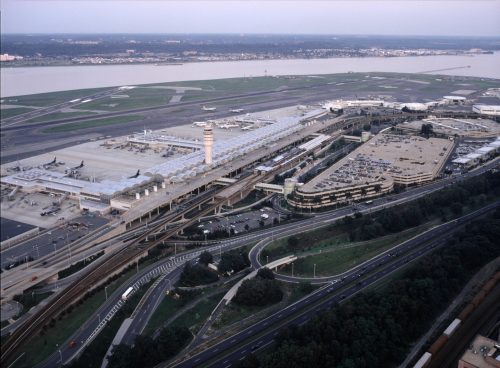
For their look at Reagan National Airport, the researchers compiled June, July and August, the main summer months, and focused on the three highest daytime temperatures and three coolest overnight temperatures in each month. They or somebody else now need to do the same thing at some weather station not influenced by square miles of buildings and concrete, vehicle traffic in the daily thousands and a busy airport operation with huge jet engines.
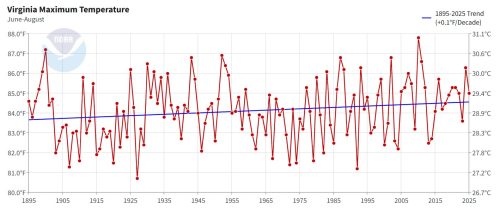
The federal data on Virginia as a whole, including the high and low temperature data by month, does reach back into the late 19th Century. The reliability of the older data must be suspected, at least because there were fewer reporting sites, but what they have indicates that same gradual warming trend. The report now includes August 2025.
With June, July and August combined, this summer’s highs were cooler than those of 31 prior years, including as far back as 1900, 1943, and 1952-54. (My mother loved to tell me about that miserable summer of my birth.) The trend line over 130 years is a rise of 1 degree Fahrenheit per century, again a change nobody would perceive without the media bombardment of hype.
But plot the average minimum over the same three months and summer 2025 has among the warmest minimums in the 130-year record. Only five years had warmer overnight temps, four of them in this century. There again is evidence that what is warming is the overnight temperature, and urban development and activity around the weather stations is a valid theory as to cause. Critics of the system delight in pointing to weather stations not just at airports, but immediately beside runways or taxiways.
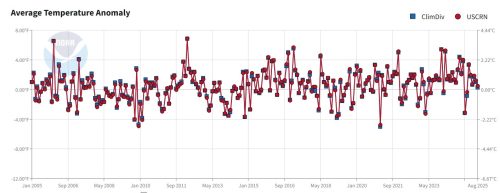
That leads to one more chart for the curious to enjoy and for the angry alarmists to complain about. The federal government (and not some skeptic group) has also been tracking a subset of U.S. weather reporting stations intentionally chosen to avoid the urban heat island effect. The U.S. Climate Reference Network includes only two Virginia locations, Charlottesville (out at the Thomas Jefferson Foundation near Monticello) and Cape Charles (again at a rural spot). No airports or downtown stations are included.
That tracking covers only 20 years, starting in 2005, but shows no warming trend. It rises and dips but overall looks very steady. What is below is U.S. data covering all 50 states.
Leave a Reply
You must be logged in to post a comment.